
Page 272 - Theoretical and Practical Interpretation of Investment Attractiveness
P. 272
3- Appendix 2020 2019 10723,2 9604,9 7401,5 6759,9 11271,1 10694,0 9076,7 7750,3 3981,9 3354,4 4406,6 6270,9 64763,3 44963,4 3857,1 3169,9 4619,4 4112,3 2077,5 1627,7 9287,7 8702,0 21821,6 18315,4 5708,0 5019,6 5009,6 4612,7 25461,8 20760,0
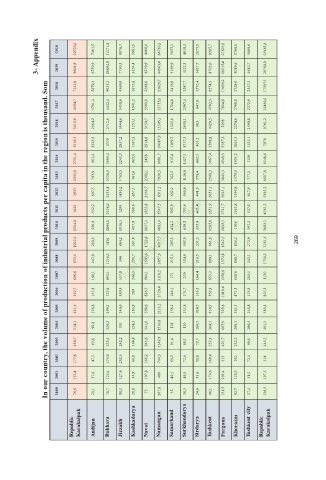
In our country, the volume of production of industrial products per capita in the region is thousand. Som
2018 7141,0 5879,3 9033,2 4569,0 2675,6 4568,0 23629,7 2416,0 3587,7 1272,4 6274,3 13099,2 3728,0 3547,3 17397,3
2017 4594,7 3701,4 4442,4 3458,6 1941,2 3509,9 13755,1 1724,8 2507,4 947,0 4702,3 7624,6 2708,0 2272,9 12460,5
2016 3512,6 2364,2 2712,6 3044,6 1553,1 3150,7 11395,1 1322,6 2058,1 903 4420,5 5998 2274,6 1590,8 9761,2
2015 3118,3 1343,5 3379 2857,2 1167,3 2914,8 10087,9 1109,7 1717,3 801,2 3598,6 5187,3 2063,3 1511,1 7970
2014 2731,4 981,4 3695,4 2243,3 965,6 2458 9081,7 915,4 1427,1 692,3 3067,4 4549,3 1931,2 1130 6548,6
2013 2335,6 793,9 3336,5 1763,5 767,6 2392,1 7920,5 762,5 1136,8 578,4 2548,3 3843,3 1575,5 777,2 6617,8
2012 1933 607,5 2535,4 1430,2 657,1 2166,7 6511,2 662,2 960,8 491,9 2051,1 3023,1 1390,8 617,9 5383,2
2011 1622 532,2 2126,6 1299 560,6 1833,8 5547,5 565,9 753,6 421,4 1651,9 2741,7 1265,8 527,8 4181,2
2010 1334,6 420,9 1800,8 1016,1 457,9 1857,1 4683,4 434,2 629,5 355,9 1285,8 2092,1 1036 397,5 3083,1
2009 1022,3 288,5 1436 684,2 301,8 1722,8 4017,7 265,3 395,9 251,3 961,8 1542,1 836,2 272,9 2181,5 269
2008 873,5 247,8 1216,3 596 295,7 1303,6 3857,6 215,3 324,9 216,5 809,1 1374,8 808,7 243,1 1730,2
2007 686,6 188,1 893,1 557,8 246,3 984,1 3118,2 171 239 164,4 653,2 1258,6 648,8 202,5 1130
2006 552,7 151,8 722,6 389,9 209 826,7 2728,4 146,1 174,7 133,5 562,3 1010,4 471,5 175,8 823,3
2005 421,5 126,6 499,1 340,9 183,9 598,6 2113,2 158,2 132,8 114,7 439,7 729,8 361,3 148,8 583,4
2004 314,1 90,8 329,2 301 124,3 341,6 1510,8 118 110 100,5 364,1 607,9 298,1 106,5 491,3
2003 239,7 63,8 233,4 242,2 104,8 243,6 1149,9 91,4 89,1 72,7 252,4 421,7 232,2 90,8 445,1
2002 177,8 47,5 173,6 202,5 66,8 166,2 744,3 69,5 72,6 51,8 169,4 313 192 72,4 314
2001 113,4 37,6 125,4 127,6 34,9 107,8 409 49,1 49,3 33,6 174,6 203,4 120,5 51,5 197,5
2000 76,6 29,1 70,7 88,3 20,8 73 267,8 35 36,3 24,6 96,1 131,5 92,7 37,4 136,5
Republic Karakalpak Andijan Bukhara Jizzakh Kashkadarya Navoi Namangan Samarkand Surkhandarya Sirdarya Tashkent Fargona Khorazm Tashkent city Republic Karakalpak