
Page 268 - Theoretical and Practical Interpretation of Investment Attractiveness
P. 268
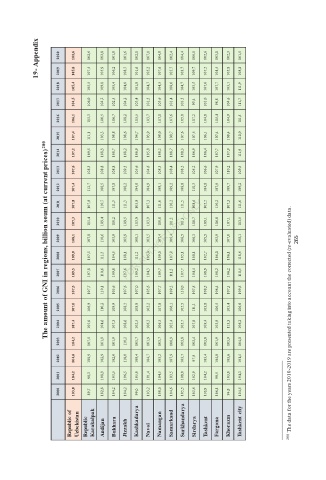
19- Appendix   2020   2019   101,6   105,8   102,6   107,5   102,8   105,9   101,8   106,2   101,6   108,7   102,1   101,6   107,1   105,2   104,8   107,6   102,4   105,7   104,4   103,7   100,1   109,7   102,6   107,5   103,0   104,5   102,3   105,8   101,5   108,8


                2018   105,4   105,5   109,8   105,4   104,0   101,8   104,7   104,5   100,6   104,7   103,5   107,0   107,7   103,1   111,9

                2017   104,5   106,0   104,2   102,5   104,2   103,4   101,3   103,6   101,4   103,5   95,4   101,0   98,8   104,6   111,7
                2016   106,1   113,3   100,5   106,7   108,2   105,5   103,7   107,8   107,6   105,8   107,2   104,8   105,4   104,9   111,5

                2015   107,4   111,1   103,3   108,8   108,6   106,7   103,9   108,0   108,7   107,6   107,5   106,1   107,4   109,4   110,0
             The amount of GNI in regions, billion soum (at current prices) 200
                2014   107,2   109,5   108,3   108,7   108,2   106,9   105,8   108,2   108,7   108,3   106,9   106,4   107,7   107,9   111,9

                2013   107,6   108,3   108,8   108,8   109,3   105,6   104,6   108,3   108,4   108,2   105,2   106,6   107,9   110,2   109,5

                2012   107,4   112,7   108,5   107,8   108,2   104,8   104,9   108,1   109,2   108,8   110,3   104,8   107,0   109,7   109,2
                2011   107,8   107,8   110,7   111,3   111,3   105,8   107,3   111,0   110,2   111,5   108,6   105,7   110,2   107,3   111,6

                2010   107,3   113,4   109,4   110,2   109,5   103,0   103,9   110,8   111,2   111,3   108,7   109,1   106,8   107,1   113,5

                2009   108,1   107,8   110,6   103,9   105,9   108,1   103,5   107,4   106,4   106,5   106,3   105,5   103,9   107,0   108,1   265

                2008   109,0   107,5   111,3   104,5   108,1   111,2   105,0   109,0   107,8   105,1   108,1   102,7   106,0   106,1   118,6

                2007   109,5   107,8   110,6   109,8   107,6   109,2   104,3   109,7   111,2   107,7   104,4   108,9   106,2   106,2   118,5
                2006   107,5   107,7   110,1   105,6   107,6   107,0   105,6   107,7   109,2   110,0   107,5   108,5   106,4   107,3   109,5

                2005   107,0   106,9   110,2   109,9   108,3   108,0   102,2   107,0   106,1   105,5   111,1   103,8   106,5   103,4   106,6

                2004   107,4   105,0   104,6   107,3   108,6   102,5   106,3   106,5   105,4   105,7   107,8   109,4   103,9   113,3   106,2   200  The data for the years 2010-2019 are presented taking into account the corrected (re-evaluated) data.

                2003   104,2   107,5   101,9   101,9   110,2   105,7   101,9   103,7   106,9   103,8   102,4   103,0   101,9   103,9   104,0
                2002   104,0   100,9   102,9   102,0   110,0   109,4   104,7   103,2   107,9   103,7   97,5   103,4   104,8   103,6   101,5

                2001   104,2   98,3   108,9   103,5   106,5   105,0   101,4   104,5   103,5   108,0   102,9   104,2   99,5   103,0   104,3

                2000   103,8   89,7   102,8   104,2   104,2   99,0   103,2   108,0   104,6   105,5   102,6   110,9   106,1   94,8   104,5

                    Republic of   Uzbekistan   Republic   Karakalpak   Andijan   Bukhara   Jizzakh   Navoi   Namangan   Samarkand   Sirdarya   Tashkent   Fargona   Khorazm
                                     Kashkadarya   Surkhandarya   Tashkent city