
Page 264 - Theoretical and Practical Interpretation of Investment Attractiveness
P. 264
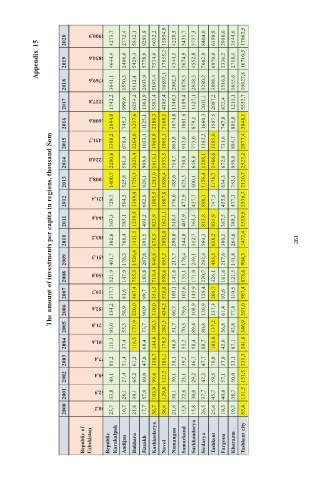
Appendix  15                    2020   2019   5900,9   5834,6   4273,7  4644,4   2772,4   2406,0   5812,1  5429,3   9291,9   5778,9   6032,2   7534,6   15954,9  17855,2   4220,5   4344,1   3431,7   2674,9   3737,3   4552,8   8404,0  7002,9   6399,9   6970,0   2990,0   2336,2   3544,6   2718,4   17062,5  16710,5


                 The amount of investments per capita in regions, thousand Som
                  2018      3769,6   3641,1   1550,3   5112,4   2693,9   5193,4   10892,1   2992,5   1878,3   2848,3   3280,2   3898,4   1516,8   1655,6   10627,8

                  2017      2227,8   1542,2   999,6   6254,2   1361,9   3583,4   4185,4   1340,3   1189,4   1427,1   2011,1   2087,2   822,4   1215,1   5552,7

                  2016      1608,6   2094,0   745,3   3237,6   1125,1   2389,3   3168,1   1074,8   1001,6   879,1   1660,3   1507,5   747,8   885,8   3848,1

                  2015      1431,7   3388,2   678,4   2264,0   1033,1   1969,9   1965,1   863,8   912,0   773,0   1382,2   1595,0   731,6   884,7   2877,4

                  2014      1224,0   2280,6   581,0   2023,4   969,6   1613,1   1933,5   714,7   730,0   646,8   1288,1   1466,6   672,0   950,0   2527,2

                  2013      1008,2   1400,7   525,8   1720,3   928,1   1281,0   1896,4   485,6   623,3   600,1   1126,4   1178,7   634,3   753,1   2120,7


                  2012      821,4   729,7   504,5   1399,9   662,8   1095,5   1907,8   376,0   472,9   437,7   890,1   747,5   455,6   477,3   2336,7

                  2011      664,6   563,3   385,1   1239,5   493,2   823,9   1621,1   318,4   407,9   365,4   813,8   835,9   387,5   388,3   1529,9

                  2010      583,2   302,6   766,4   1321,5   391,5   678,5   2031,0   290,0   344,0   312,7   564,3   618,2   300,1   264,6   1472,4   261

                  2009      451,3   401,7   176,3   1526,4   207,8   846,8   695,2   213,7   178,4   249,1   292,4   485,5   217,6   141,8   904,3

                  2008      350,0   521,9   147,9   755,3   183,8   719,4   598,6   141,6   133,1   171,0   220,7   326,1   161,6   121,5   878,6
                  2007      219,7   377,7   81,6   467,4   99,7   351,5   526,8   105,1   102,6   145,9   129,4   205,7   92,6   110,5   507,4

                  2006      152,6   134,2   58,9   220,0   90,9   310,0   434,2   66,7   79,6   108,9   120,9   137,3   61,4   77,4   391,0

                  2005      121,0   95,0   55,3   171,9   73,7   190,3   282,3   51,7   70,5   89,4   80,8   137,2   56,8   43,8   346,9

                  2004      101,6   111,3   37,4   116,5   60,4   144,0   178,5   46,9   55,2   58,4   80,7   105,0   42,6   87,1   341,6
                  2003      77,4   85,2   51,4   61,2   47,8   136,7   181,1   38,1   39,2   46,7   47,7   70,8   37,9   33,1   231,3

                  2002      60,4   49,1   27,4   65,2   69,0   99,6   112,2   30,1   23,1   29,2   42,3   59,5   57,1   50,0   151,5

                  2001      52,9   33,8   28,1   39,1   57,9   103,9   129,8   30,1   22,6   30,0   37,7   45,7   40,6   38,7   131,5
                  2000      30,2   23,7   16,7   21,8   17,7   56,7   58,6   21,6   15,8   15,8   26,5   25,6   19,5   19,3   85,4


                       Republic of   Uzbekistan   Republic   Karakalpak   Andijan   Bukhara   Jizzakh   Kashkadarya   Namangan   Samarkand   Surkhandarya   Sirdarya   Tashkent   Fargona   Khorazm   Tashkent city


                                            Navoi