
Page 91 - Theoretical and Practical Interpretation of Investment Attractiveness
P. 91
It should be noted that depending on regional conditions, their natural-geographical
location, the development of socio-economic infrastructure, the level of urbanization and
socio-demographic status, the value of the main funds created in the regions and having
exactly the same capacity can be different. Under the influence of these factors, an increase
in the value of the main funds occurs.
In order to have regional information on the reproduction of fixed assets and their
current value, a balance of fixed assets is drawn up. In this balance, the value of the main
funds at the beginning of the year and at the end of the year is reflected in the form of a table
(table 2.4.1). The table includes statistical information related to the amount of basic funds
available in all industries and sectors, enterprises and organizations, and their reproduction,
regardless of the property form of the territory.
In the balance sheet: the current value of the main fund at the beginning of the year,
the new funds that were added, the part that was out of operation and was out of use during
the year, the value of the main funds at the end of the year after deducting (depreciation value),
as well as the average annual value of the main funds are reflected. The average annual value
of the main funds available in the regions is calculated according to the average chronological
and actual size (value) determined in the reporting period.
The balance of the main Funds is reflected according to the following scheme:
2.4.2-fig.
Classification The value of During the year value of
of the main the main the main
The main The main Total capital Main stock Other Total
funds funds (main fond at the
fund put to fund from stock in use that is types of retired
according to fund) at the end of the
use. the and out of completely obsolet capital
the form of beginning of year
capital capital out of use e main stock.
ownership the year
repair repair and fond.
obsolete.
А 1 2 3 4=2+3 5 6 7=5+6 8=1+4-7
Studying the main funds available in the region, analyzing them theoretically and
methodically, calculating their real value is the main factor for forecasting the economic
development of the region.
Қорақалпоғистон
Республикаси
5% Андижон
Тошкент шаҳри 4% Қорақалпоғистон
21% Республикаси…
Бухоро Андижон
8% Тошкент шаҳри 8%
17%
Бухоро
6%
Жиззах
3%
Хоразм Жиззах
Хоразм 5% 4%
2%
Фарғона
Фарғона 8%
5% Қашқадарё
Қашқадарё 8%
13%
Тошкент Навоий
9%
7%
Тошкент
Сирдарё Навоий 12% Наманган
2% 9% Сирдарё 5%
Сурхондарё Наманган 2%
6% Самарқанд 7% Сурхондарё Самарқанд
6% 5% 9%
88
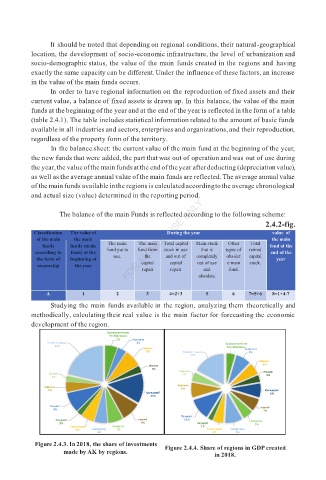
Figure 2.4.3. In 2018, the share of investments
Figure 2.4.4. Share of regions in GDP created
made by AK by regions.
in 2018.