
Page 93 - Theoretical and Practical Interpretation of Investment Attractiveness
P. 93
Тошкент шаҳри 44778,8
88567,7
6663,2
Хоразм
20822,3
11320,0
Фарғона
36538,9
18994,4
Тошкент 62661,7
Сирдарё 7174,5
12186,4
9923,0
Сурхондарё
24003,6
13426,0
Самарқанд
42378,1
11982,5
Наманган 26632,3
16042,6
Навоий
49015,1
19921,7
Қашқадарё
34618,1
12974,2
Жиззах
17445,9
11248,7
Бухоро
30758,1
8755,1
Андижон 37913,7
Қорақалпоғистон Республикаси 8167,4
21200,9
0,0 10000,020000,030000,040000,050000,060000,070000,080000,090000,0100000,0
АКИ ЯҲМ
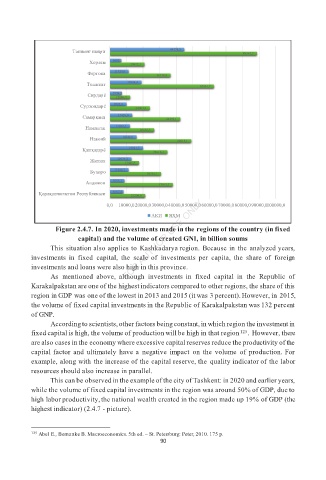
Figure 2.4.7. In 2020, investments made in the regions of the country (in fixed
capital) and the volume of created GNI, in billion soums
This situation also applies to Kashkadarya region. Because in the analyzed years,
investments in fixed capital, the scale of investments per capita, the share of foreign
investments and loans were also high in this province.
As mentioned above, although investments in fixed capital in the Republic of
Karakalpakstan are one of the highest indicators compared to other regions, the share of this
region in GDP was one of the lowest in 2013 and 2015 (it was 3 percent). However, in 2015,
the volume of fixed capital investments in the Republic of Karakalpakstan was 132 percent
of GNP.
According to scientists, other factors being constant, in which region the investment in
fixed capital is high, the volume of production will be high in that region 125 . However, there
are also cases in the economy where excessive capital reserves reduce the productivity of the
capital factor and ultimately have a negative impact on the volume of production. For
example, along with the increase of the capital reserve, the quality indicator of the labor
resources should also increase in parallel.
This can be observed in the example of the city of Tashkent: in 2020 and earlier years,
while the volume of fixed capital investments in the region was around 50% of GDP, due to
high labor productivity, the national wealth created in the region made up 19% of GDP (the
highest indicator) (2.4.7 - picture).
125 Abel E., Bernanke B. Macroeconomics. 5th ed. – St. Petersburg: Peter, 2010. 175 p.
90