
Page 92 - Theoretical and Practical Interpretation of Investment Attractiveness
P. 92
Қорақалпоғистон
Қорақалпоғистон Республикаси
Республикаси Тошкент шаҳри 4% Андижон
4% Андижон 18% 8%
4% Бухоро
Тошкент шаҳри 6% Бухоро
22% 6%
Жиззах
6% Хоразм Жиззах
4%
4%
Қашқадарё
Хоразм Қашқадарё
3% 10% Фарғона 7%
7%
Фарғона
6%
Навоий Навоий
Тошкент 8% Тошкент 10%
9% 12%
Сирдарё Наманган Наманган
4% 6% Сирдарё 5%
Сурхондарё Самарқанд 2% Сурхондарё Самарқанд
7%
5% 5%
8%
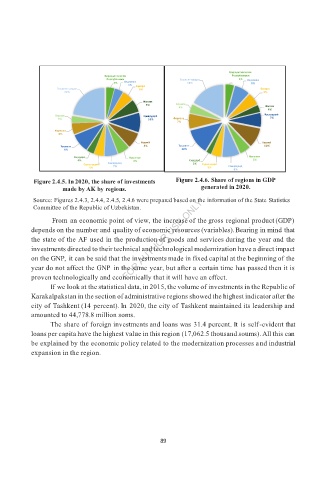
Figure 2.4.5. In 2020, the share of investments Figure 2.4.6. Share of regions in GDP
made by AK by regions. generated in 2020.
Source: Figures 2.4.3, 2.4.4, 2.4.5, 2.4.6 were prepared based on the information of the State Statistics
Committee of the Republic of Uzbekistan.
From an economic point of view, the increase of the gross regional product (GDP)
depends on the number and quality of economic resources (variables). Bearing in mind that
the state of the AF used in the production of goods and services during the year and the
investments directed to their technical and technological modernization have a direct impact
on the GNP, it can be said that the investments made in fixed capital at the beginning of the
year do not affect the GNP in the same year, but after a certain time has passed then it is
proven technologically and economically that it will have an effect.
If we look at the statistical data, in 2015, the volume of investments in the Republic of
Karakalpakstan in the section of administrative regions showed the highest indicator after the
city of Tashkent (14 percent). In 2020, the city of Tashkent maintained its leadership and
amounted to 44,778.8 million soms.
The share of foreign investments and loans was 31.4 percent. It is self-evident that
loans per capita have the highest value in this region (17,062.5 thousand soums). All this can
be explained by the economic policy related to the modernization processes and industrial
expansion in the region.
89