
Page 21 - Lennox International - May 2020
P. 21
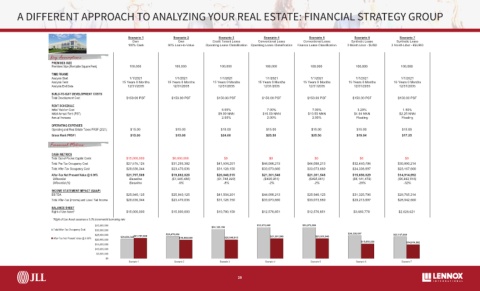
A DIFFERENT APPROACH TO ANALYZING YOUR REAL ESTATE: FINANCIAL STRATEGY GROUP

                       Executive Summary


                     Analysis as of 1/1/2021           Scenario 1         Scenario 2         Scenario 3         Scenario 4         Scenario 5         Scenario 6         Scenario 7
                                                         Own                Own           Credit Tenant Lease  Conventional Lease  Conventional Lease  Synthetic Lease  Synthetic Lease
                                                       100% Cash        60% Loan-to-Value  Operating Lease Classification  Operating Lease Classification  Finance Lease Classification  3 Month Libor - $USD  3 Month Libor - €EURO

                      Key Assumptions
                       PREMISES SIZE
                       Premises Size (Rentable Square Feet)  100,000      100,000            100,000            100,000            100,000            100,000            100,000
                       TIME FRAME
                       Analysis Start                  1/1/2021           1/1/2021           1/1/2021           1/1/2021           1/1/2021           1/1/2021           1/1/2021
                       Analysis Term                15 Years 0 Months  15 Years 0 Months  15 Years 0 Months  15 Years 0 Months  15 Years 0 Months  15 Years 0 Months  15 Years 0 Months
                       Analysis End Date               12/31/2035         12/31/2035         12/31/2035         12/31/2035         12/31/2035         12/31/2035         12/31/2035
                       BUILD-TO-SUIT DEVELOPMENT COSTS
                       Total Development Cost         $150.00 PSF        $150.00 PSF        $150.00 PSF        $150.00 PSF        $150.00 PSF        $150.00 PSF        $150.00 PSF
                       RENT SCHEDULE
                       Initial Yield on Cost                                                  6.00%              7.00%              7.00%              3.29%              1.50%
                       Initial Annual Rent (PSF)       $0.00 NNN          $0.00 NNN          $9.00 NNN         $10.50 NNN         $10.50 NNN          $4.94 NNN          $2.25 NNN
                       Annual Increase                 $0.00 PSF          $0.00 PSF           2.00%              2.00%              2.00%              Floating           Floating
                       OPERATING EXPENSES
                       Operating and Real Estate Taxes PRSF (2021)  $15.00  $15.00            $15.00             $15.00             $15.00             $15.00             $15.00
                       Gross Rent (PRSF)                $15.00             $15.00             $24.00             $25.50             $25.50             $19.94             $17.25
                      Financial Metrics

                       CASH METRICS
                       Total Out-of-Pocket Capital Costs  $15,000,000    $6,000,000            $0                 $0                 $0                 $0                 $0
                       Total Pre-Tax Occupancy Cost   $27,515,125        $31,293,382        $41,504,201        $44,098,213        $44,098,213        $32,450,796        $30,890,214
                       Total After-Tax Occupancy Cost  $20,636,344       $23,470,036        $31,128,150        $33,073,660        $33,073,660        $24,338,097        $23,167,660
                       After-Tax Net Present Value @ 6.00%  $21,797,508  $19,802,028        $20,048,515        $21,301,548        $21,301,548        $15,656,029        $14,914,992
                       Differential                    Baseline          ($1,995,480)       ($1,748,993)        ($495,961)         ($495,961)        ($6,141,479)       ($6,882,516)
                       Differential (%)                Baseline             -9%                -8%                -2%                -2%               -28%               -32%
                       INCOME STATEMENT IMPACT (GAAP)
                       EBITDA                         $25,940,125        $25,940,125        $41,504,201        $44,098,213        $25,940,125        $31,325,796        $29,765,214
                       Total After-Tax (Income) and Loss / Net Income  $20,636,344  $23,470,036  $31,128,150   $33,073,660        $33,073,660        $29,213,097        $28,042,660
                       BALANCE SHEET
                       Right of Use Asset*            $15,000,000        $15,000,000        $10,780,158        $12,576,851        $12,576,851        $3,693,770         $2,626,621
                       *Right of Use Asset assumes a 5.0% incremental borrowing rate
                                         $35,000,000                                      $31,128,150        $33,073,660        $33,073,660
                       Total After-Tax Occupancy Cost  $30,000,000
                                         $25,000,000     $21,797,508   $23,470,036                                $21,301,548         $21,301,548   $24,338,097       $23,167,660
                       After-Tax Net Present Value @ 6.00%  $20,636,344     $19,802,028        $20,048,515
                                         $20,000,000
                                                                                                                                                         $15,656,029        $14,914,992
                                         $15,000,000
                                         $10,000,000
                                         $5,000,000
                                             $0
                                                       Scenario 1         Scenario 2         Scenario 3         Scenario 4          Scenario 5         Scenario 6         Scenario 7
                    Page 1
                    5/19/2020                                                                    JLL Financial Strategy Group                                   This page is subject to the disclaimer found on the Table of Contents
                                                                                                     20