
Page 86 - JOJAPS_VOL15
P. 86
Iwan Kesuma Sihombing / JOJAPS – JOURNAL ONLINE JARINGAN PENGAJIAN SENI BINA
b. All requested variables entered.
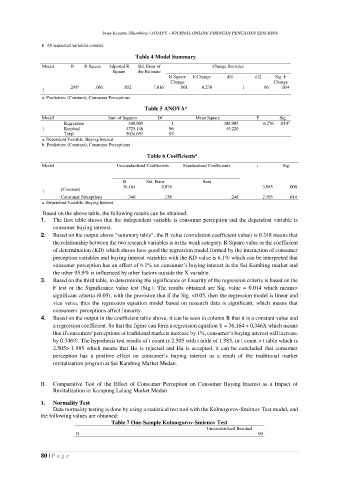
Table 4 Model Summary
Model R R Square Adjusted R Std. Error of Change Statistics
Square the Estimate
R Square F Change df1 df2 Sig. F
Change Change
.248 a .061 .052 7.016 .061 6.276 1 96 .014
1
a. Predictors: (Constant), Consumer Perceptions
a
Table 5 ANOVA
Model Sum of Squares Df Mean Square F Sig.
Regression 308.905 1 308.905 6.276 .014
b
1 Residual 4725.146 96 49.220
Total 5034.051 97
a. Dependent Variable: Buying Interest
b. Predictors: (Constant), Consumer Perceptions
a
Table 6 Coefficients
Model Unstandardized Coefficients Standardized Coefficients t Sig.
B Std. Error Beta
36.164 9.074 3.985 .000
(Constant)
1
Consumer Perceptions .346 .138 .248 2.505 .014
a. Dependent Variable: Buying Interest
Based on the above table, the following results can be obtained:
1. The first table shows that the independent variable is consumer perception and the dependent variable is
consumer buying interest.
2. Based on the output above "summary table", the R value (correlation coefficient value) is 0.248 means that
the relationship between the two research variables is in the weak category. R Square value or the coefficient
of determination (KD) which shows how good the regression model formed by the interaction of consumer
perception variables and buying interest variables with the KD value is 6.1% which can be interpreted that
consumer perception has an effect of 6.1% on consumer’s buying interest in the Sei Kambing market and
the other 95.9% is influenced by other factors outside the X variable.
3. Based on the third table, in determining the significance or linearity of the regression criteria is based on the
F test or the Significance value test (Sig.). The results obtained are Sig. value = 0.014 which means>
significant criteria (0.05), with the provision that if the Sig. <0.05, then the regression model is linear and
vice versa, thus the regression equation model based on research data is significant, which means that
consumers' perceptions affect linearity.
4. Based on the output in the coefficient table above, it can be seen in column B that it is a constant value and
a regression coefficient. So that the figure can form a regression equation Y = 36,164 + 0,346X which means
that if consumers' perceptions of traditional markets increase by 1%, consumer’s buying interest will increase
by 0.346%. The hypothesis test results of t count is 2.505 with t table of 1.985, or t count > t table which is
2.505> 1.985 which means that Ho is rejected and Ha is accepted, it can be concluded that consumer
perception has a positive effect on consumer’s buying interest as a result of the traditional market
revitalization program at Sei Kambing Market Medan.
B. Comparative Test of the Effect of Consumer Perception on Consumer Buying Interest as a Impact of
Revitalization in Kampung Lalang Market Medan
1. Normality Test
Data normality testing is done by using a statistical test tool with the Kolmogorov-Smirnov Test model, and
the following values are obtained:
Table 7 One-Sample Kolmogorov-Smirnov Test
Unstandardized Residual
N 90
80 | P a g e