Page 87 - JOJAPS_VOL15
P. 87

Iwan Kesuma Sihombing / JOJAPS – JOURNAL ONLINE JARINGAN PENGAJIAN SENI BINA

                                                    Mean                               .0000000
                            Normal Parameters
                                        a,b
                                                    Std. Deviation                    6.24269754
                                                    Absolute                               .052
                            Most Extreme Differences   Positive                            .052
                                                    Negative                              -.043
                            Kolmogorov-Smirnov Z                                           .497
                            Asymp. Sig. (2-tailed)                                         .966
                            a. Test distribution is Normal.
                            b. Calculated from data.
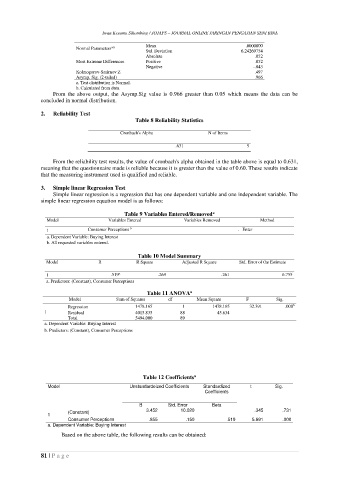
                    From  the  above  output,  the  Asymp.Sig  value  is  0.966  greater  than  0.05  which  means  the  data  can  be
               concluded in normal distribution.

               2.   Reliability Test
                                                 Table 8 Reliability Statistics
                                           Cronbach's Alpha               N of Items

                                                               .631                     5

                    From the reliability test results, the value of cronbach's alpha obtained in the table above is equal to 0.631,
               meaning that the questionnaire made is reliable because it is greater than the value of 0.60. These results indicate
               that the measuring instrument used is qualified and reliable.

               3.   Simple linear Regression Test
                    Simple linear regression is a regression that has one dependent variable and one independent variable. The
               simple linear regression equation model is as follows:

                                                                            a
                                             Table 9 Variables Entered/Removed
                 Model                 Variables Entered          Variables Removed         Method
                 1              Consumer Perceptions    b                            .  Enter
                 a. Dependent Variable: Buying Interest
                 b. All requested variables entered.

                                                 Table 10 Model Summary
                 Model              R            R Square        Adjusted R Square   Std. Error of the Estimate

                 1                      .519   a         .269                  .261                 6.755
                 a. Predictors: (Constant), Consumer Perceptions

                                                                    a
                                                     Table 11 ANOVA
                         Model            Sum of Squares    df        Mean Square       F         Sig.
                         Regression              1478.165        1          1478.165     32.391      .000   b
                 1       Residual                4015.835       88           45.634
                         Total                   5494.000       89
                 a. Dependent Variable: Buying Interest
                 b. Predictors: (Constant), Consumer Perceptions


                                                   Table 12 Coefficients
                                                                     a
                  Model                        Unstandardeized Coefficients   Standardized   t    Sig.
                                                                         Coefficients

                                                  B         Std. Error      Beta
                         (Constant)                 3.452       10.020                    .345      .731
                  1
                         Consumer Perceptions        .855         .150           .519     5.691     .000
                  a. Dependent Variable: Buying Interest
                       Based on the above table, the following results can be obtained:


               81 | P a g e
   82   83   84   85   86   87   88   89   90   91   92