
Page 89 - JOJAPS_VOL15
P. 89
Iwan Kesuma Sihombing / JOJAPS – JOURNAL ONLINE JARINGAN PENGAJIAN SENI BINA
a. Listwise deletion based on all variables in the procedure.
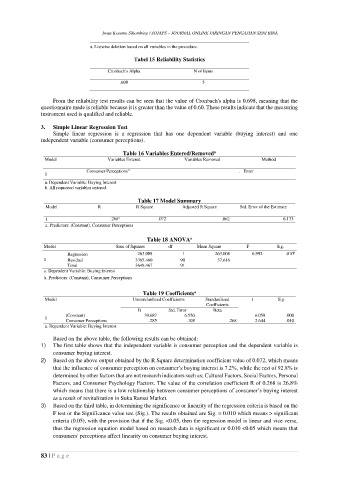
Tabel 15 Reliability Statistics
Cronbach's Alpha N of Items
.698 5
From the reliability test results can be seen that the value of Cronbach's alpha is 0.698, meaning that the
questionnaire made is reliable because it is greater than the value of 0.60. These results indicate that the measuring
instrument used is qualified and reliable.
3. Simple Linear Regression Test
Simple linear regression is a regression that has one dependent variable (buying interest) and one
independent variable (consumer perceptions).
Table 16 Variables Entered/Removed
a
Model Variables Entered Variables Removed Method
b
Consumer Perceptions . Enter
1
a. Dependent Variable: Buying Interest
b. All requested variables entered.
Table 17 Model Summary
Model R R Square Adjusted R Square Std. Error of the Estimate
1 .268 a .072 .062 6.133
a. Predictors: (Constant), Consumer Perceptions
Table 18 ANOVA
a
Model Sum of Squares df Mean Square F Sig.
Regression 263.008 1 263.008 6.992 .010 b
1 Residual 3385.460 90 37.616
Total 3648.467 91
a. Dependent Variable: Buying Interest
b. Predictors: (Constant), Consumer Perceptions
Table 19 Coefficients
a
Model Unstandardized Coefficients Standardized t Sig.
Coefficients
B Std. Error Beta
(Constant) 39.687 6.550 6.059 .000
1
Consumer Perceptions .285 .108 .268 2.644 .010
a. Dependent Variable: Buying Interest
Based on the above table, the following results can be obtained:
1) The first table shows that the independent variable is consumer perception and the dependent variable is
consumer buying interest.
2) Based on the above output obtained by the R Square determination coefficient value of 0.072, which means
that the influence of consumer perception on consumer’s buying interest is 7.2%, while the rest of 92.8% is
determined by other factors that are not research indicators such as; Cultural Factors, Social Factors, Personal
Factors, and Consumer Psychology Factors. The value of the correlation coefficient R of 0.268 is 26.8%
which means that there is a low relationship between consumer perceptions of consumer’s buying interest
as a result of revitalization in Suka Ramai Market.
3) Based on the third table, in determining the significance or linearity of the regression criteria is based on the
F test or the Significance value test (Sig.). The results obtained are Sig. = 0.010 which means > significant
criteria (0.05), with the provision that if the Sig. <0.05, then the regression model is linear and vice versa,
thus the regression equation model based on research data is significant or 0.010 <0.05 which means that
consumers' perceptions affect linearity on consumer buying interest.
83 | P a g e