
Page 88 - JOJAPS_VOL15
P. 88
Iwan Kesuma Sihombing / JOJAPS – JOURNAL ONLINE JARINGAN PENGAJIAN SENI BINA
1. The first table shows that the independent variable is consumer perception and the dependent variable is
consumer buying interest.
2. Based on the output above "summary table", the R value (correlation coefficient value) is 0.519 means that
the relationship between the two research variables in the category is quite strong. R Square value or
coefficient of determination (KD) which shows how good the regression model formed by the interaction of
independent variables and dependent variables with KD values is 26.9% which can be interpreted that the
independent variable X has an effect of 26.9% on the variable Y and 73.1% are influenced by other factors
outside the X variable.
3. Based on the third table in determining the significance or linearity of the regression criteria determined
based on the F test or the Significance value test (Sig.). The results obtained are Sig. = 0,000, which means
<significant criteria (0.05), with the provision that if the Sig. <0.05, then the regression model is linear and
vice versa, thus the regression equation model based on research data is significant, which means that
consumers' perceptions affect linearity.
4. Based on the output in the coefficient table above, it can be seen in column B that it is a constant value and
a regression coefficient. So that the figure can form a regression equation Y = 3.452 + 0.855X which means
that if consumers' perceptions of traditional markets increase by 1%, Consumer’s buying interest will
increase by 0.855%. The hypothesis test obtained the results of t count of 5.691 with t table of 1.662 or t
count > t table ie 5.691> 1.662 means that Ho is rejected and Ha is accepted, it can be concluded that
consumer perception has a positive effect on consumer’s buying interest as a result of the revitalization
program at Kampung Lalang Medan.
C. Comparative Test of the Effect of Consumer Perception on Consumer Buying Interest as a Impact of
Revitalization in Suka Ramai Market Medan
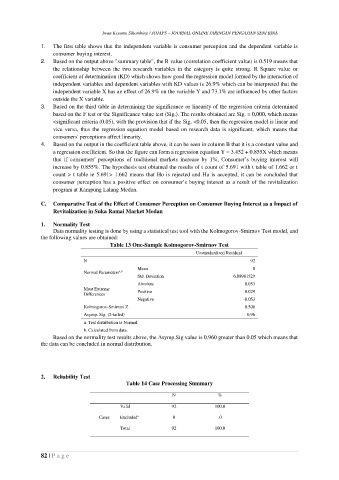
1. Normality Test
Data normality testing is done by using a statistical test tool with the Kolmogorov-Smirnov Test model, and
the following values are obtained:
Table 13 One-Sample Kolmogorov-Smirnov Test
Unstandardized Residual
N 92
Mean 0
Normal Parameters
a,b
Std. Deviation 6.08981529
Absolute 0.053
Most Extreme
Differences Positive 0.029
Negative -0.053
Kolmogorov-Smirnov Z 0.506
Asymp. Sig. (2-tailed) 0.96
a. Test distribution is Normal.
b. Calculated from data.
Based on the normality test results above, the Asymp.Sig value is 0.960 greater than 0.05 which means that
the data can be concluded in normal distribution.
2. Reliability Test
Table 14 Case Processing Summary
N %
Valid 92 100.0
Cases Excluded 0 .0
a
Total 92 100.0
82 | P a g e