
Page 492 - Fundamentals of Management Myths Debunked (2017)_Flat
P. 492
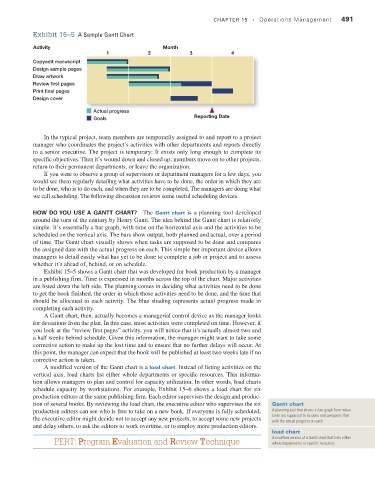
Exhibit 15–5  A Sample Gantt Chart                         CHAPTER 15   •  Operations Management    491

                    Activity                                  Month
                                            1            2             3            4
                    Copyedit manuscript
                    Design sample pages
                    Draw artwork
                    Review first pages
                    Print final pages
                    Design cover
                                       Actual progress
                                       Goals                            Reporting Date

                       In the typical project, team members are temporarily assigned to and report to a project
                    manager who coordinates the project’s activities with other departments and reports directly
                    to a senior executive. The project is temporary: It exists only long enough to complete its
                    specific objectives. Then it’s wound down and closed up; members move on to other projects,
                    return to their permanent departments, or leave the organization.
                       If you were to observe a group of supervisors or department managers for a few days, you
                    would see them regularly detailing what activities have to be done, the order in which they are
                    to be done, who is to do each, and when they are to be completed. The managers are doing what
                    we call scheduling. The following discussion reviews some useful scheduling devices.


                    how do you use a gantt Chart? The  Gantt chart is a planning tool developed
                    around the turn of the century by Henry Gantt. The idea behind the Gantt chart is relatively
                    simple. It’s essentially a bar graph, with time on the horizontal axis and the activities to be
                    scheduled on the vertical axis. The bars show output, both planned and actual, over a period
                    of time. The Gantt chart visually shows when tasks are supposed to be done and compares
                    the assigned date with the actual progress on each. This simple but important device allows
                    managers to detail easily what has yet to be done to complete a job or project and to assess
                    whether it’s ahead of, behind, or on schedule.
                       Exhibit 15–5 shows a Gantt chart that was developed for book production by a manager
                    in a publishing firm. Time is expressed in months across the top of the chart. Major activities
                    are listed down the left side. The planning comes in deciding what activities need to be done
                    to get the book finished, the order in which those activities need to be done, and the time that
                    should be allocated to each activity. The blue shading represents actual progress made in
                    completing each activity.
                       A Gantt chart, then, actually becomes a managerial control device as the manager looks
                    for deviations from the plan. In this case, most activities were completed on time. However, if
                    you look at the “review first pages” activity, you will notice that it’s actually almost two and
                    a half weeks behind schedule. Given this information, the manager might want to take some
                    corrective action to make up the lost time and to ensure that no further delays will occur. At
                    this point, the manager can expect that the book will be published at least two weeks late if no
                    corrective action is taken.
                       A modified version of the Gantt chart is a load chart. Instead of listing activities on the
                    vertical axis, load charts list either whole departments or specific resources. This informa-
                    tion allows managers to plan and control for capacity utilization. In other words, load charts
                    schedule capacity by workstations. For example, Exhibit 15–6 shows a load chart for six
                    production editors at the same publishing firm. Each editor supervises the design and produc-
                    tion of several books. By reviewing the load chart, the executive editor who supervises the six   Gantt chart
                    production editors can see who is free to take on a new book. If everyone is fully scheduled,   A planning tool that shows in bar graph form when
                    the executive editor might decide not to accept any new projects, to accept some new projects   tasks are supposed to be done and compares that
                                                                                                  with the actual progress on each
                    and delay others, to ask the editors to work overtime, or to employ more production editors.
                                                                                                  load chart
                           PERT: Program Evaluation and Review Technique                          A modified version of a Gantt chart that lists either
                                                                                                  whole departments or specific resources