
Page 493 - Fundamentals of Management Myths Debunked (2017)_Flat
P. 493
492 Part 5 • Controlling
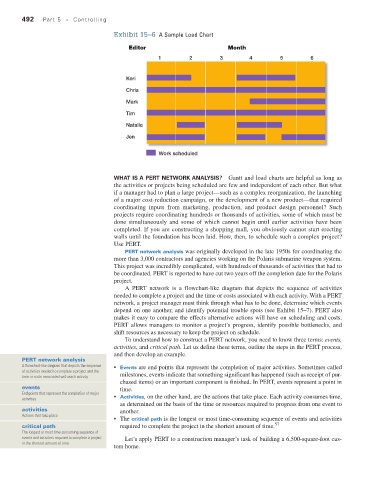
Exhibit 15–6 A Sample load Chart
Editor Month
1 2 3 4 5 6
Keri
Chris
Mark
Tim
Natalie
Jen
Work scheduled
what Is a Pert network analysIs? Gantt and load charts are helpful as long as
the activities or projects being scheduled are few and independent of each other. But what
if a manager had to plan a large project—such as a complex reorganization, the launching
of a major cost-reduction campaign, or the development of a new product—that required
coordinating inputs from marketing, production, and product design personnel? Such
projects require coordinating hundreds or thousands of activities, some of which must be
done simultaneously and some of which cannot begin until earlier activities have been
completed. If you are constructing a shopping mall, you obviously cannot start erecting
walls until the foundation has been laid. How, then, to schedule such a complex project?
Use PERT.
PERT network analysis was originally developed in the late 1950s for coordinating the
more than 3,000 contractors and agencies working on the Polaris submarine weapon system.
This project was incredibly complicated, with hundreds of thousands of activities that had to
be coordinated. PERT is reported to have cut two years off the completion date for the Polaris
project.
A PERT network is a flowchart-like diagram that depicts the sequence of activities
needed to complete a project and the time or costs associated with each activity. With a PERT
network, a project manager must think through what has to be done, determine which events
depend on one another, and identify potential trouble spots (see Exhibit 15–7). PERT also
makes it easy to compare the effects alternative actions will have on scheduling and costs.
PERT allows managers to monitor a project’s progress, identify possible bottlenecks, and
shift resources as necessary to keep the project on schedule.
To understand how to construct a PERT network, you need to know three terms: events,
activities, and critical path. Let us define these terms, outline the steps in the PERT process,
and then develop an example.
PERT network analysis
A flowchart-like diagram that depicts the sequence • Events are end points that represent the completion of major activities. Sometimes called
of activities needed to complete a project and the milestones, events indicate that something significant has happened (such as receipt of pur-
time or costs associated with each activity
chased items) or an important component is finished. In PERT, events represent a point in
events time.
End points that represent the completion of major • Activities, on the other hand, are the actions that take place. Each activity consumes time,
activities
as determined on the basis of the time or resources required to progress from one event to
activities another.
Actions that take place
• The critical path is the longest or most time-consuming sequence of events and activities
critical path required to complete the project in the shortest amount of time. 57
The longest or most time-consuming sequence of
events and activities required to complete a project Let’s apply PERT to a construction manager’s task of building a 6,500-square-foot cus-
in the shortest amount of time
tom home.