
Page 13 - NYS_ESS_03-2021_FLIPBOOKFILE
P. 13
to access the parcel geometry theme of a city or county, Might the same misleading parcel geometry data foster decisions
any landowner can potentially see and be misled by land in property disputes erroneously arising from inaccurate
boundaries projected onto the ground as a line or a wall on displays? How useful is the superimposed information to
their smartphone’s AR display or AR glasses. There MUST be a supporting facility management such as underground utility
way to communicate the inexactness of these displays whether improvements that improperly appear to be correlated to
it is boundary lines with a width of the uncertainty or with parcel corners? When the uncertainty of parcel boundaries
some other method. Perhaps in this situation, a pop-up display is not visualized, how does a user know if it is sufficient to
with a message like: “CAUTION: DATA UNCERTAINTY support certain decisions? And if uncertainty is quantified,
MAKES LOCATION IN THIS AREA UNRELIABLE!” what is the most effective (and economical) approach to
Otherwise confusion will reign as a landowner fails to see communicating such information? Hint: hidden deep inside
or misunderstands the boundary line going down their a nearly incomprehensible metadata attribute table is not the
property fence or wall. Based on the uncertainty we know solution. As professionals, we could throw up our arms and
exists in most GIS data, such visualization may mistakenly go declare the situation a mess. On the other hand, we could
through a house or indicate a violation of setback rules. It is also consider the situation an opportunity and communicate
a disservice to publish digital parcel lines and points as static, persuasively to resolve these upcoming difficulties.
exact features. As surveyors, we know this error is foreseeable For surveyors to assert themselves into the maintenance of
but preventable. We should actively promote solutions, not digital parcel boundaries will, for some, be an introduction to
passively wait to say “told you so.”
new concepts. For example:
Digital parcel boundaries created without the rigorous 1. A parcel corner or a parcel boundary measurements
network data analysis used by Bureau of Land Management, (coordinates, bearing or distance) of known reliability
likely lack indicia of positional uncertainty and so it is hard and uncertainty must published in such a way that others
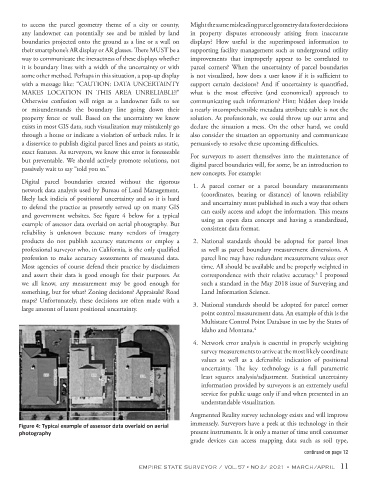
to defend the practice as presently served up on many GIS can easily access and adopt the information. This means
and government websites. See figure 4 below for a typical using an open data concept and having a standardized,
example of assessor data overlaid on aerial photography. But consistent data format.
reliability is unknown because many vendors of imagery
products do not publish accuracy statements or employ a 2. National standards should be adopted for parcel lines
professional surveyor who, in California, is the only qualified as well as parcel boundary measurement dimensions. A
profession to make accuracy assessments of measured data. parcel line may have redundant measurement values over
Most agencies of course defend their practice by disclaimers time. All should be available and be properly weighted in
3
and assert their data is good enough for their purposes. As correspondence with their relative accuracy. I proposed
we all know, any measurement may be good enough for such a standard in the May 2018 issue of Surveying and
something, but for what? Zoning decisions? Appraisals? Road Land Information Science.
maps? Unfortunately, these decisions are often made with a 3. National standards should be adopted for parcel corner
large amount of latent positional uncertainty.
point control measurement data. An example of this is the
Multistate Control Point Database in use by the States of
Idaho and Montana. 4
4. Network error analysis is essential in properly weighting
survey measurements to arrive at the most likely coordinate
values as well as a defensible indication of positional
uncertainty. The key technology is a full parametric
least squares analysis/adjustment. Statistical uncertainty
information provided by surveyors is an extremely useful
service for public usage only if and when presented in an
understandable visualization.
Augmented Reality survey technology exists and will improve
Figure 4: Typical example of assessor data overlaid on aerial immensely. Surveyors have a peek at this technology in their
photography present instruments. It is only a matter of time until consumer
grade devices can access mapping data such as soil type,
continued on page 12
EMPIRE STATE SURVEYOR / VOL. 57 • NO 2/ 2021 • MARCH/APRIL 11