Page 328 - Krugmans Economics for AP Text Book_Neat
P. 328
figure 29.8                  The Long -run Determination of the Interest Rate


                 (a) The Liquidity Preference Model of the Interest Rate  (b) The Loanable Funds Model of the Interest Rate
           Interest                                           Interest
            rate, r  1. In the long run, the rise in the price level  rate, r
                     shifts the money demand curve to the right, . . .
                                                                                  S 1
                                                                                             S
                       MS 1        MS 2                                                       2
                                         2. . . . which raises
                                     E 3  the interest rate back
                 r 1                     to its original level . . .  r 1       E 1
                      E 1                                                                    3. . . . reducing real
                                                                                             GDP and the supply
                                                                                             of loanable funds
                                     E 2           MD 2                                      until aggregate
                 r 2                                                r 2                E 2   output equals
                                         MD 1                                                potential output.
                                                                                           D

                       M 1         M 2             Quantity                   Q 1     Q 2           Quantity of
                                                   of money                                      loanable funds


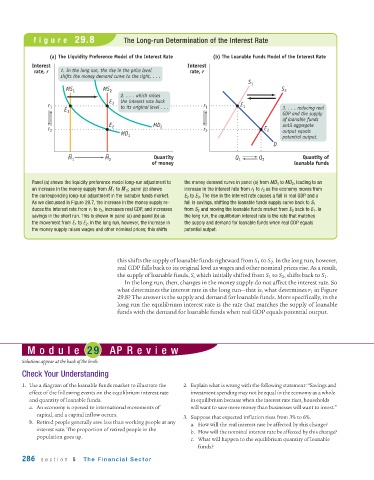
           Panel (a) shows the liquidity preference model long-run adjustment to   the money demand curve in panel (a) from MD 1 to MD 2 , leading to an
                                     ––  ––
           an increase in the money supply from M 1 to M 2 ; panel (b) shows   increase in the interest rate from r 1 to r 2 as the economy moves from
           the corresponding long-run adjustment in the loanable funds market.   E 2 to E 3 . The rise in the interest rate causes a fall in real GDP and a
           As we discussed in Figure 29.7, the increase in the money supply re-  fall in savings, shifting the loanable funds supply curve back to S 1
           duces the interest rate from r 1 to r 2 , increases real GDP, and increases  from S 2 and moving the loanable funds market from E 2 back to E 1 . In
           savings in the short run. This is shown in panel (a) and panel (b) as   the long run, the equilibrium interest rate is the rate that matches
           the movement from E 1 to E 2 . In the long run, however, the increase in  the supply and demand for loanable funds when real GDP equals
           the money supply raises wages and other nominal prices; this shifts   potential output.


                                       this shifts the supply of loanable funds rightward from S 1 to S 2 . In the long run, however,
                                       real GDP falls back to its original level as wages and other nominal prices rise. As a result,
                                       the supply of loanable funds, S, which initially shifted from S 1 to S 2 , shifts back to S 1 .
                                          In the long run, then, changes in the money supply do not affect the interest rate. So
                                       what determines the interest rate in the long run—that is, what determines r 1 in Figure
                                       29.8? The answer is the supply and demand for loanable funds. More specifically, in the
                                       long run the equilibrium interest rate is the rate that matches the supply of loanable
                                       funds with the demand for loanable funds when real GDP equals potential output.


          Module 29 AP Review
        Solutions appear at the back of the book.

        Check Your Understanding
        1. Use a diagram of the loanable funds market to illustrate the  2. Explain what is wrong with the following statement: “Savings and
           effect of the following events on the equilibrium interest rate  investment spending may not be equal in the economy as a whole
           and quantity of loanable funds.                     in equilibrium because when the interest rate rises, households
           a. An economy is opened to international movements of  will want to save more money than businesses will want to invest.”
             capital, and a capital inflow occurs.
                                                             3. Suppose that expected inflation rises from 3% to 6%.
           b. Retired people generally save less than working people at any
                                                               a. How will the real interest rate be affected by this change?
             interest rate. The proportion of retired people in the
                                                               b. How will the nominal interest rate be affected by this change?
             population goes up.
                                                               c. What will happen to the equilibrium quantity of loanable
                                                                  funds?
        286   section 5     The Financial Sector

