Page 532 - Krugmans Economics for AP Text Book_Neat
P. 532
always its opportunity cost. That is, the real cost of something is what you must give
        Individual producer surplus is the net
                                       up to get it.
        gain to an individual seller from selling a
                                          So it is good economics to talk of the minimum price at which someone will sell a
        good. It is equal to the difference between the
        price received and the seller’s cost.  good as the “cost” of selling that good, even if he or she doesn’t spend any money to
                                       make the good available for sale. Of course, in most real-world markets the sellers are
        Total producer surplus in a market is the
                                       also those who produce the good and therefore do spend money to make the good
        sum of the individual producer surpluses of
        all the sellers of a good in a market.  available for sale. In this case the cost of making the good available for sale includes
        Economists use the term producer surplus  monetary costs, but it may also include other opportunity costs.
        to refer both to individual and to total  Getting back to the example, suppose that Andrew sells his book for $30. Clearly he
        producer surplus.              has gained from the transaction: he would have been willing to sell for only $5, so
                                       he has gained $25. This net gain, the difference between the price he actually gets and
                                       his cost—the minimum price at which he would have been willing to sell—is known as
                                       his individual producer surplus.
                                          Just as we derived the demand curve from the willingness to pay of different con-
                                       sumers, we can derive the supply curve from the cost of different producers. The step-
                                       shaped curve in Figure 49.6 shows the supply curve implied by the costs shown in the
                                       accompanying table. At a price less than $5, none of the students are willing to sell; at a
                                       price between $5 and $15, only Andrew is willing to sell, and so on.
                                          As in the case of consumer surplus, we can add the individual producer surpluses of
                                       sellers to calculate the total producer surplus, the total net gain to all sellers in the
                                       market. Economists use the term producer surplus to refer to either total or individ-
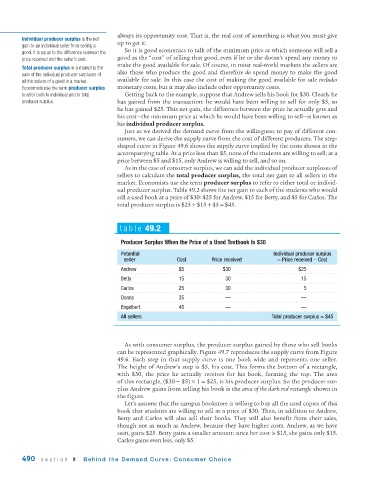
                                       ual producer surplus. Table 49.2 shows the net gain to each of the students who would
                                       sell a used book at a price of $30: $25 for Andrew, $15 for Betty, and $5 for Carlos. The
                                       total producer surplus is $25 + $15 + $5 = $45.


                                        table 49.2

                                         Producer Surplus When the Price of a Used Textbook Is $30
                                         Potential                                         Individual producer surplus
                                          seller           Cost       Price received        = Price received − Cost
                                         Andrew             $5            $30                      $25
                                         Betty              15             30                       15
                                         Carlos             25             30                       5
                                         Donna              35             —                        —
                                         Engelbert          45             —                        —
                                         All sellers                                      Total producer surplus = $45


                                          As with consumer surplus, the producer surplus gained by those who sell books
                                       can be represented graphically. Figure 49.7 reproduces the supply curve from Figure
                                       49.6. Each step in that supply curve is one book wide and represents one seller.
                                       The height of Andrew’s step is $5, his cost. This forms the bottom of a rectangle,
                                       with $30, the price he actually receives for his book, forming the top. The area
                                       of this rectangle, ($30 − $5) × 1 = $25, is his producer surplus. So the producer sur-
                                       plus Andrew gains from selling his book is the area of the dark red rectangle shown in
                                       the figure.
                                          Let’s assume that the campus bookstore is willing to buy all the used copies of this
                                       book that students are willing to sell at a price of $30. Then, in addition to Andrew,
                                       Betty and Carlos will also sell their books. They will also benefit from their sales,
                                       though not as much as Andrew, because they have higher costs. Andrew, as we have
                                       seen, gains $25. Betty gains a smaller amount: since her cost is $15, she gains only $15.
                                       Carlos gains even less, only $5.

        490   section 9     Behind the Demand Curve: Consumer Choice

