Page 533 - Krugmans Economics for AP Text Book_Neat
P. 533
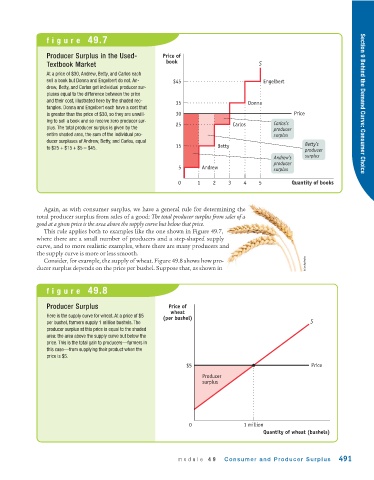
figure 49.7


                Producer Surplus in the Used-         Price of
                                                       book
                Textbook Market                                                       S
                At a price of $30, Andrew, Betty, and Carlos each
                sell a book but Donna and Engelbert do not. An-  $45                   Engelbert
                drew, Betty, and Carlos get individual producer sur-
                pluses equal to the difference between the price
                and their cost, illustrated here by the shaded rec-  35           Donna                                Section 9 Behind the Demand Curve: Consumer Choice
                tangles. Donna and Engelbert each have a cost that
                is greater than the price of $30, so they are unwill-  30                        Price
                ing to sell a book and so receive zero producer sur-  25     Carlos        Carlos’s
                plus. The total producer surplus is given by the                           producer
                entire shaded area, the sum of the individual pro-                         surplus
                ducer surpluses of Andrew, Betty, and Carlos, equal                                  Betty’s
                to $25 + $15 + $5 = $45.                   15           Betty
                                                                                                     producer
                                                                                           Andrew’s  surplus
                                                                                           producer
                                                           5       Andrew                  surplus

                                                           0      1    2    3    4    5         Quantity of books


               Again, as with consumer surplus, we have a general rule for determining the
             total producer surplus from sales of a good: The total producer surplus from sales of a
             good at a given price is the area above the supply curve but below that price.
               This rule applies both to examples like the one shown in Figure 49.7,
             where there are a small number of producers and a step-shaped supply
             curve, and to more realistic examples, where there are many producers and
             the supply curve is more or less smooth.
               Consider, for example, the supply of wheat. Figure 49.8 shows how pro-                istockphoto
             ducer surplus depends on the price per bushel. Suppose that, as shown in


                figure 49.8


                Producer Surplus                        Price of
                                                         wheat
                Here is the supply curve for wheat. At a price of $5
                                                      (per bushel)
                per bushel, farmers supply 1 million bushels. The                                      S
                producer surplus at this price is equal to the shaded
                area: the area above the supply curve but below the
                price. This is the total gain to producers—farmers in
                this case—from supplying their product when the
                price is $5.
                                                              $5                                       Price
                                                                   Producer
                                                                   surplus


                                                               0                 1 million
                                                                                       Quantity of wheat (bushels)


                                                           module 49      Consumer and Producer Surplus         491

