
Page 805 - Krugmans Economics for AP Text Book_Neat
P. 805
What Causes Poverty?
Poverty is often blamed on lack of education, and educational attainment clearly has a
strong positive effect on income level—those with more education earn, on average,
higher incomes than those with less education. For example, in 1979 the average
hourly wage of men with a college degree was 36% higher than that of men with only a
high school diploma; by 2009 the “college premium” had increased to 81%. Lack of
proficiency in English is also a barrier to higher income. For example, Mexican-born
male workers in the United States—two-thirds of whom have not graduated from high
school and many of whom have poor English skills—earn less than half of what native-
born men earn. And it’s important not to overlook the role of racial and gender dis- Section 14 Market Failure and the Role of Government
crimination; although less pervasive today than 50 years ago, discrimination still erects
formidable barriers to advancement for many Americans. Non-whites earn less and are
less likely to be employed than whites with comparable levels of education. Studies
find that African-American males suffer persistent discrimination by employers in
favor of whites, African-American women, and Hispanic immigrants. Women earn
lower incomes than men with similar qualifications.
In addition, one important source of poverty that should not be overlooked is bad
luck. Many families find themselves impoverished when a wage-earner loses a job or a
family member falls seriously ill.
Consequences of Poverty
The consequences of poverty are often severe, particularly for children. Currently,
more than 17.4% of children in the United States live in poverty. Poverty is often
associated with a lack of access to health care, which can lead to further health
problems that erode the ability to attend school and work later in life. Affordable
housing is also frequently a problem, leading poor families to move often and
disrupting school and work schedules. Recent medical studies have shown that
children raised in severe poverty tend to suffer from lifelong learning disabilities.
As a result, American children growing up in or near poverty don’t have an equal
chance at the starting line: they tend to be at a disadvantage throughout their lives.
For example, even talented children who come from poor families are unlikely to
finish college.
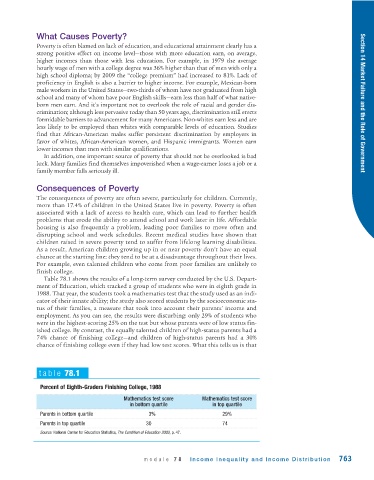
Table 78.1 shows the results of a long-term survey conducted by the U.S. Depart-
ment of Education, which tracked a group of students who were in eighth grade in
1988. That year, the students took a mathematics test that the study used as an indi-
cator of their innate ability; the study also scored students by the socioeconomic sta-
tus of their families, a measure that took into account their parents’ income and
employment. As you can see, the results were disturbing: only 29% of students who
were in the highest-scoring 25% on the test but whose parents were of low status fin-
ished college. By contrast, the equally talented children of high-status parents had a
74% chance of finishing college—and children of high-status parents had a 30%
chance of finishing college even if they had low test scores. What this tells us is that
table 78.1
Percent of Eighth-Graders Finishing College, 1988
Mathematics test score Mathematics test score
in bottom quartile in top quartile
Parents in bottom quartile 3% 29%
Parents in top quartile 30 74
Source: National Center for Education Statistics, The Condition of Education 2003, p. 47.
module 78 Income Inequality and Income Distribution 763