
Page 806 - Krugmans Economics for AP Text Book_Neat
P. 806
fyi
The Impeccable Economic Logic of Early Childhood Intervention Programs
One of the most vexing problems facing any so- significant social, intellectual, and financial program whose participants, by age 20, were
ciety is how to break what researchers call the advantages for kids who would otherwise be 26% more likely to have finished high school,
“cycle of poverty”: children who grow up with at risk of dropping out of high school and of 35% less likely to have been charged in juve-
disadvantaged socioeconomic backgrounds are engaging in criminal behavior. Children in pro- nile court, and 40% less likely to have re-
far more likely to remain trapped in poverty as grams like Head Start were less likely to en- peated a grade compared to individuals of
adults, even after we account for differences in gage in such destructive behaviors and more similar socio economic background who did
ability. They are more likely to be unemployed or likely to end up with a job and to earn a high not attend pre school. The observed external
underemployed, to engage in crime, and to suf- salary later in life. Another study by re- benefits to society of these programs are so
fer chronic health problems. searchers at the University of Pittsburgh in large that the Brookings Institution predicts
Early childhood intervention has offered 2003 looked at early-childhood intervention that providing high-quality pre school educa-
some hope of breaking the cycle. A 2006 programs from a dollars-and-cents perspec- tion to every American child would result in an
study by the RAND Corporation found that tive, finding from $4 to $7 in benefits for increase in GDP, the total value of a country’s
high-quality early-childhood programs that every $1 spent on early-childhood interven- domestic output, by almost 2%, representing
focus on education and health care lead to tion programs. The study also pointed to one over 3 million more jobs.
poverty is, to an important degree, self-perpetuating: the children of the poor start at
such a disadvantage relative to other Americans that it’s very hard for them to
achieve a better life.
Economic Inequality
The United States is a rich country. In 2008, the average U.S. household had an income
of more than $68,000, far exceeding the poverty threshold. How is it possible, then,
that so many Americans still live in poverty? The answer is that income is unequally
distributed, with many households earning much less than the average and others
earning much more.
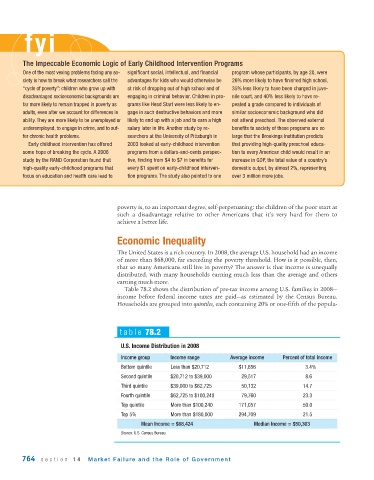
Table 78.2 shows the distribution of pre-tax income among U.S. families in 2008—
income before federal income taxes are paid—as estimated by the Census Bureau.
Households are grouped into quintiles, each containing 20% or one-fifth of the popula-
table 78.2
U.S. Income Distribution in 2008
Income group Income range Average income Percent of total income
Bottom quintile Less than $20,712 $11,656 3.4%
Second quintile $20,712 to $39,000 29,517 8.6
Third quintile $39,000 to $62,725 50,132 14.7
Fourth quintile $62,725 to $100,240 79,760 23.3
Top quintile More than $100,240 171,057 50.0
Top 5% More than $180,000 294,709 21.5
Mean Income = $68,424 Median Income = $50,303
Source: U.S. Census Bureau.
764 section 14 Market Failure and the Role of Gover nment