
Page 808 - Krugmans Economics for AP Text Book_Neat
P. 808
fyi
Long-Term Trends in Income Inequality in the United States
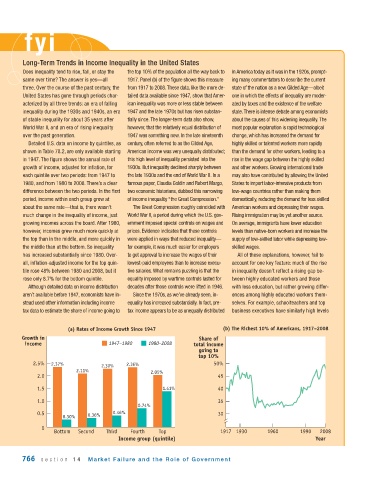
Does inequality tend to rise, fall, or stay the the top 10% of the population all the way back to in America today as it was in the 1920s, prompt-
same over time? The answer is yes—all 1917. Panel (b) of the figure shows this measure ing many commentators to describe the current
three. Over the course of the past century, the from 1917 to 2008. These data, like the more de- state of the nation as a new Gilded Age—albeit
United States has gone through periods char- tailed data available since 1947, show that Amer- one in which the effects of inequality are moder-
acterized by all three trends: an era of falling ican inequality was more or less stable between ated by taxes and the existence of the welfare
inequality during the 1930s and 1940s, an era 1947 and the late 1970s but has risen substan- state. There is intense debate among economists
of stable inequality for about 35 years after tially since. The longer-term data also show, about the causes of this widening inequality. The
World War II, and an era of rising inequality however, that the relatively equal distribution of most popular explanation is rapid technological
over the past generation. 1947 was something new. In the late nineteenth change, which has increased the demand for
Detailed U.S. data on income by quintiles, as century, often referred to as the Gilded Age, highly skilled or talented workers more rapidly
shown in Table 78.2, are only available starting American income was very unequally distributed; than the demand for other workers, leading to a
in 1947. The figure shows the annual rate of this high level of inequality persisted into the rise in the wage gap between the highly skilled
growth of income, adjusted for inflation, for 1930s. But inequality declined sharply between and other workers. Growing international trade
each quintile over two periods: from 1947 to the late 1930s and the end of World War II. In a may also have contributed by allowing the United
1980, and from 1980 to 2008. There’s a clear famous paper, Claudia Goldin and Robert Margo, States to import labor-intensive products from
difference between the two periods. In the first two economic historians, dubbed this narrowing low-wage countries rather than making them
period, income within each group grew at of income inequality “the Great Compression.” domestically, reducing the demand for less skilled
about the same rate—that is, there wasn’t The Great Compression roughly coincided with American workers and depressing their wages.
much change in the inequality of income, just World War II, a period during which the U.S. gov- Rising immigration may be yet another source.
growing incomes across the board. After 1980, ernment imposed special controls on wages and On average, immigrants have lower education
however, incomes grew much more quickly at prices. Evidence indicates that these controls levels than native-born workers and increase the
the top than in the middle, and more quickly in were applied in ways that reduced inequality— supply of low-skilled labor while depressing low-
the middle than at the bottom. So inequality for example, it was much easier for employers skilled wages.
has increased substantially since 1980. Over- to get approval to increase the wages of their All of these explanations, however, fail to
all, inflation-adjusted income for the top quin- lowest-paid employees than to increase execu- account for one key feature: much of the rise
tile rose 48% between 1980 and 2008, but it tive salaries. What remains puzzling is that the in inequality doesn’t reflect a rising gap be-
rose only 8.7% for the bottom quintile. equality imposed by wartime controls lasted for tween highly educated workers and those
Although detailed data on income distribution decades after those controls were lifted in 1946. with less education, but rather growing differ-
aren’t available before 1947, economists have in- Since the 1970s, as we’ve already seen, in- ences among highly educated workers them-
stead used other information including income equality has increased substantially. In fact, pre- selves. For example, schoolteachers and top
tax data to estimate the share of income going to tax income appears to be as unequally distributed business executives have similarly high levels
(a) Rates of Income Growth Since 1947 (b) The Richest 10% of Americans, 1917–2008
Growth in Share of
income 1947–1980 1980–2008 total income
going to
top 10%
2.5% 2.37% 2.30% 2.36% 50%
2.11% 2.05%
2.0 45
1.5 1.41% 40
1.0 35
0.74%
0.5 0.36% 0.46% 30
0.30%
0
Bottom Second Third Fourth Top 1917 1930 1960 1990 2008
Income group (quintile) Year
766 section 14 Market Failure and the Role of Gover nment