
Page 812 - Krugmans Economics for AP Text Book_Neat
P. 812
The Effects of Programs on Poverty and Inequality
Because the people who receive government transfers tend to be different from those
who are taxed to pay for those transfers, the U.S. welfare state has the effect of redis-
tributing income from some people to others. Each year the Census Bureau estimates
the effect of this redistribution in a report titled “The Effects of Government Taxes and
Transfers on Income and Poverty.” The report calculates only the direct effects of taxes
and transfers, without taking into account changes in behavior that the taxes and
transfers might cause. For example, the report doesn’t try to estimate how many older
Americans who are now retired would still be working if they weren’t receiving Social
Security checks. As a result, the estimates are only a partial indicator of the true effects
of the welfare state. Nonetheless, the results are striking.
Table 78.4 shows how taxes and government transfers affected the poverty threshold
for the population as a whole and for different age groups in 2008. It shows two numbers
for each group: the percentage of the group that would have had incomes below the poverty
threshold if the government neither collected taxes nor made transfers, and the percent-
age that actually fell below the poverty threshold once taxes and transfers were taken into
account. (For technical reasons, the second number is somewhat lower than the standard
measure of the poverty rate.) Overall, the combined effect of taxes and transfers is to cut
the U.S. poverty rate nearly in half. The elderly derived the greatest benefits from redistri-
bution, which reduced their potential poverty rate of 47.4% to an actual poverty rate of 9.7%.
table 78.4
Effects of Taxes and Transfers on the Poverty Rate, 2008
Poverty rate without Poverty rate with
Group (by age) taxes and transfers taxes and transfers
All 21.4% 12.1%
Under 18 22.0 15.9
18 to 64 15.9 11.1
65 and over 47.4 9.7
Source: Census.gov, ASEC: Table 2. Percent of Persons in Poverty, by Definition of Income and Selected Characteristics: 2008
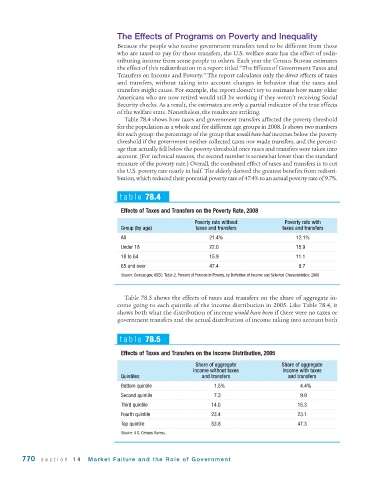
Table 78.5 shows the effects of taxes and transfers on the share of aggregate in-
come going to each quintile of the income distribution in 2005. Like Table 78.4, it
shows both what the distribution of income would have been if there were no taxes or
government transfers and the actual distribution of income taking into account both
table 78.5
Effects of Taxes and Transfers on the Income Distribution, 2005
Share of aggregate Share of aggregate
income without taxes income with taxes
Quintiles and transfers and transfers
Bottom quintile 1.5% 4.4%
Second quintile 7.3 9.9
Third quintile 14.0 15.3
Fourth quintile 23.4 23.1
Top quintile 53.8 47.3
Source: U.S. Census Bureau.
770 section 14 Market Failure and the Role of Gover nment