
Page 809 - Krugmans Economics for AP Text Book_Neat
P. 809
of education, but executive paychecks have a few “superstars”—a group that includes lit- top corporate executives—much higher in-
risen dramatically and teachers’ salaries have eral superstars in the entertainment world but comes than it did a generation ago. It’s still
not. For some reason, the economy now pays also such groups as Wall Street traders and not entirely clear what caused the change.
past 35 years even though the country as a whole has become considerably richer. Also,
extreme inequality, as found in Latin America, is often associated with political instabil-
ity, because of tension between a wealthy minority and the rest of the population.
It’s important to realize, however, that the data shown in Table 78.2 overstate the
true degree of inequality in America, for several reasons. One is that the data represent
a snapshot for a single year, whereas the incomes of many individual families fluctuate
over time. That is, many of those near the bottom in any given year are having an un-
usually bad year and many of those at the top are having an unusually good one. Over
time, their incomes will revert to a more normal level. So a table showing average in-
comes within quintiles over a longer period, such as a decade, would not show as much
inequality. Furthermore, a family’s income tends to vary over its life cycle: most people
earn considerably less in their early working years than they will later in life, and then
experience a considerable drop in income when they retire. Consequently, the numbers
in Table 78.2, which combine young workers, mature workers, and retirees, show more
inequality than would a table that compares families of similar ages.
Despite these qualifications, there is a considerable amount of genuine inequality in
the United States. Moreover, the fact that families’ incomes fluctuate from year to year
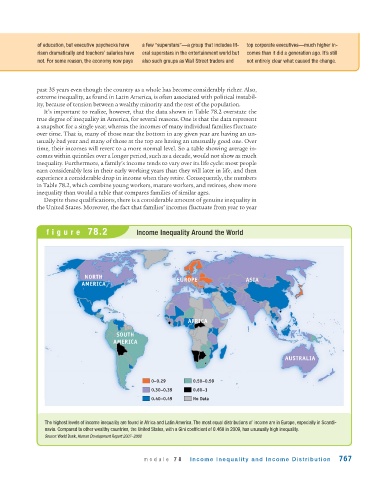
figure 78.2 Income Inequality Around the World
NORTH
EUROPE ASIA
AMERICA
AFRICA
SOUTH
AMERICA
AUSTRALIA
0–0.29 0.50–0.59
0.30–0.39 0.60–1
0.40–0.49 No Data
The highest levels of income inequality are found in Africa and Latin America. The most equal distributions of income are in Europe, especially in Scandi-
navia. Compared to other wealthy countries, the United States, with a Gini coefficient of 0.468 in 2009, has unusually high inequality.
Source: World Bank, Human Development Report 2007–2008
module 78 Income Inequality and Income Distribution 767