
Page 830 - Krugmans Economics for AP Text Book_Neat
P. 830
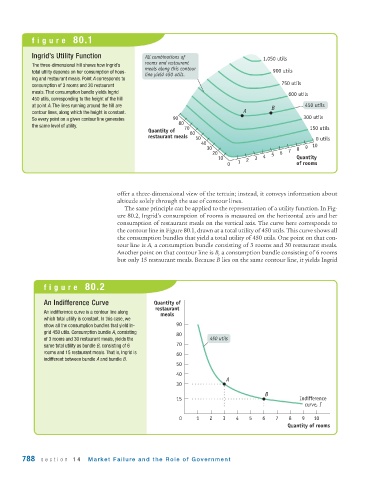
figure  80.1


           Ingrid’s Utility Function             All combinations of                   1,050 utils
                                                 rooms and restaurant
           The three-dimensional hill shows how Ingrid’s
                                                 meals along this contour
           total utility depends on her consumption of hous-                              900 utils
                                                 line yield 450 utils.
           ing and restaurant meals. Point A corresponds to
                                                                                             750 utils
            consumption of 3 rooms and 30 restaurant
            meals. That consumption bundle yields Ingrid
                                                                                               600 utils
            450 utils, corresponding to the height of the hill
            at point A. The lines running around the hill are                             B          450 utils
           contour lines, along which the height is constant.                    A
           So every point on a given contour line generates  90                                     300 utils
                                                           80
           the same level of utility.                        70                                       150 utils
                                                  Quantity of  60
                                                  restaurant meals  50                                  0 utils
                                                                   40                                  10
                                                                     30                           8  9
                                                                       20                 5  6  7
                                                                        10        2  3  4         Quantity
                                                                           0   1                  of rooms


                                       offer a three-dimensional view of the terrain; instead, it conveys information about
                                       altitude solely through the use of contour lines.
                                          The same principle can be applied to the representation of a utility function. In Fig-
                                       ure 80.2, Ingrid’s consumption of rooms is measured on the horizontal axis and her
                                       consumption of restaurant meals on the vertical axis. The curve here corresponds to
                                       the contour line in Figure 80.1, drawn at a total utility of 450 utils. This curve shows all
                                       the consumption bundles that yield a total utility of 450 utils. One point on that con-
                                       tour line is A, a consumption bundle consisting of 3 rooms and 30 restaurant meals.
                                       Another point on that contour line is B, a consumption bundle consisting of 6 rooms
                                       but only 15 restaurant meals. Because B lies on the same contour line, it yields Ingrid


               figure  80.2

               An Indifference Curve               Quantity of
                                                    restaurant
               An indifference curve is a contour line along
                                                      meals
               which total utility is constant. In this case, we
               show all the consumption bundles that yield In-  90
               grid 450 utils. Consumption bundle A, consisting  80
               of 3 rooms and 30 restaurant meals, yields the         450 utils
               same total utility as bundle B, consisting of 6  70
               rooms and 15 restaurant meals. That is, Ingrid is  60
               indifferent between bundle A and bundle B.
                                                           50
                                                           40
                                                                           A
                                                           30
                                                                                        B
                                                           15                                      Indifference
                                                                                                     curve, I

                                                            0    1    2   3   4    5   6   7    8   9   10
                                                                                               Quantity of rooms


        788   section  14     Market Failure and the Role of Gover nment