Page 833 - Krugmans Economics for AP Text Book_Neat
P. 833

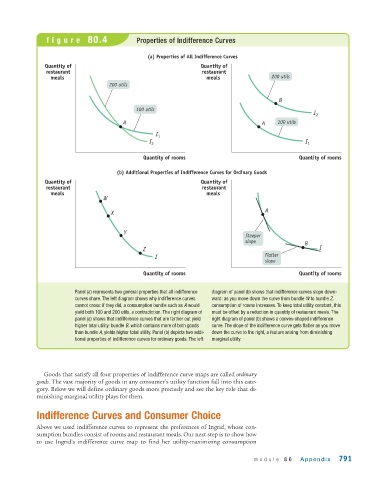
figure  80.4                  Properties of Indifference Curves


                                                 (a) Properties of All Indifference Curves
                Quantity of                                        Quantity of
                restaurant                                         restaurant
                  meals                                              meals                200 utils
                                     200 utils

                                                                                            B
                                              100 utils
                                                                                                        I 2
                                         A                                             A    100 utils

                                                    I 1
                                                  I 2                                                I 1

                                                Quantity of rooms                                  Quantity of rooms

                                       (b) Additional Properties of Indifference Curves for Ordinary Goods
                Quantity of                                        Quantity of
                restaurant                                         restaurant
                  meals                                              meals
                                   W
                                                                                        A
                                     X


                                         Y
                                                                                 Steeper
                                                                                 slope               B
                                                Z                                                         I
                                                    I                                   Flatter
                                                                                        slope
                                                Quantity of rooms                                  Quantity of rooms


                          Panel (a) represents two general properties that all indifference  diagram of panel (b) shows that indifference curves slope down-
                          curves share. The left diagram shows why indifference curves  ward: as you move down the curve from bundle W to bundle Z,
                          cannot cross: if they did, a consumption bundle such as A would  consumption of rooms increases. To keep total utility constant, this
                          yield both 100 and 200 utils, a contradiction. The right diagram of  must be offset by a reduction in quantity of restaurant meals. The
                          panel (a) shows that indifference curves that are farther out yield  right diagram of panel (b) shows a convex-shaped indifference
                          higher total utility: bundle B, which contains more of both goods  curve. The slope of the indifference curve gets flatter as you move
                          than bundle A, yields higher total utility. Panel (b) depicts two addi-  down the curve to the right, a feature arising from diminishing
                          tional properties of indifference curves for ordinary goods. The left  marginal utility.


               Goods that satisfy all four properties of indifference curve maps are called ordinary
             goods. The vast majority of goods in any consumer’s utility function fall into this cate-
             gory. Below we will define ordinary goods more precisely and see the key role that di-
             minishing marginal utility plays for them.


             Indifference Curves and Consumer Choice

             Above we used indifference curves to represent the preferences of Ingrid, whose con-
             sumption bundles consist of rooms and restaurant meals. Our next step is to show how
             to use Ingrid’s indifference curve map to find her utility-maximizing consumption

                                                                                    module  80     Appendix     791
   828   829   830   831   832   833   834   835   836   837   838