
Page 831 - Krugmans Economics for AP Text Book_Neat
P. 831
the same total utility—450 utils—as A. We say that Ingrid is indifferent between A and B:
An indifference curve is a line that
because bundles A and B yield the same total utility level, Ingrid is equally well off with
shows all the consumption bundles that
either bundle. yield the same amount of total utility for
A contour line that maps consumption bundles yielding the same amount of total an individual. Section 14 Appendix
utility is known as an indifference curve. An individual is always indifferent between
The entire utility function of an individual
any two bundles that lie on the same indifference curve. For a given consumer, there is can be represented by an indifference
an indifference curve corresponding to each possible level of total utility. For example, curve map, a collection of indifference
the indifference curve in Figure 80.2 shows consumption bundles that yield Ingrid 450 curves in which each curve corresponds
utils; different indifference curves would show consumption bundles that yield Ingrid to a different total utility level.
400 utils, 500 utils, and so on.
A collection of indifference curves that represents a given consumer’s entire utility
function, with each indifference curve corresponding to a different level of total util-
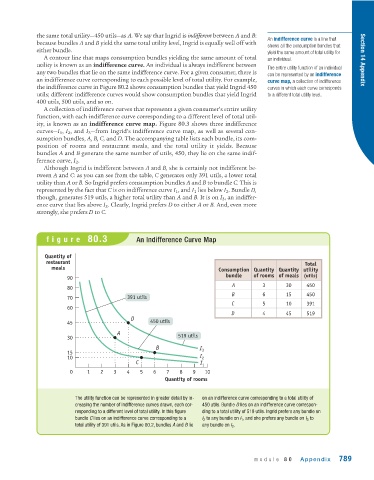
ity, is known as an indifference curve map. Figure 80.3 shows three indifference
curves—I 1 , I 2 , and I 3 —from Ingrid’s indifference curve map, as well as several con-
sumption bundles, A, B, C, and D. The accompanying table lists each bundle, its com-
position of rooms and restaurant meals, and the total utility it yields. Because
bundles A and B generate the same number of utils, 450, they lie on the same indif-
ference curve, I 2 .
Although Ingrid is indifferent between A and B, she is certainly not indifferent be-
tween A and C: as you can see from the table, C generates only 391 utils, a lower total
utility than A or B. So Ingrid prefers consumption bundles A and B to bundle C. This is
represented by the fact that C is on indifference curve I 1 , and I 1 lies below I 2 . Bundle D,
though, generates 519 utils, a higher total utility than A and B. It is on I 3 , an indiffer-
ence curve that lies above I 2 . Clearly, Ingrid prefers D to either A or B. And, even more
strongly, she prefers D to C.
figure 80.3 An Indifference Curve Map
Quantity of
restaurant Total
meals Consumption Quantity Quantity utility
bundle of rooms of meals (utils)
90
A 3 30 450
80
B 6 15 450
70 391 utils
C 5 10 391
60
D 4 45 519
D
45 450 utils
A
30 519 utils
B I 3
15
10 I 2
C I 1
0 1 2 3 4 5 6 7 8 9 10
Quantity of rooms
The utility function can be represented in greater detail by in- on an indifference curve corresponding to a total utility of
creasing the number of indifference curves drawn, each cor- 450 utils. Bundle D lies on an indifference curve correspon-
responding to a different level of total utility. In this figure ding to a total utility of 519 utils. Ingrid prefers any bundle on
bundle C lies on an indifference curve corresponding to a I 2 to any bundle on I 1 , and she prefers any bundle on I 3 to
total utility of 391 utils. As in Figure 80.2, bundles A and B lie any bundle on I 2 .
module 80 Appendix 789