
Page 834 - Krugmans Economics for AP Text Book_Neat
P. 834
bundle, given her budget constraint, which arises because she must choose a consump-
tion bundle that costs no more than her total income.
It’s important to understand how our analysis here relates to what we did in Module
51. We are not offering a new theory of consumer behavior in this module—consumers
are assumed to maximize total utility as before. In particular, we know that consumers
will follow the optimal consumption rule: the optimal consumption bundle lies on the
budget line, and the marginal utility per dollar is the same for every good in the bundle.
But as we’ll see shortly, we can derive this optimal consumer behavior in a somewhat
different way—a way that yields deeper insights into consumer choice.
The Marginal Rate of Substitution
The first element of our approach is a new concept, the marginal rate of substitution. The
essence of this concept is illustrated in Figure 80.5.
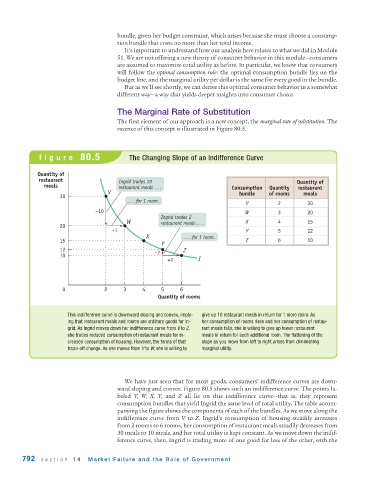
figure 80.5 The Changing Slope of an Indifference Curve
Quantity of
restaurant Ingrid trades 10 Quantity of
meals restaurant meals . . . Consumption Quantity restaurant
V bundle of rooms meals
30
. . . for 1 room.
V 2 30
–10 W 3 20
Ingrid trades 2
W restaurant meals . . . X 4 15
20
+1 Y 5 12
X . . . for 1 room.
15 Z 6 10
Y
12 –2 Z
10
+1 I
0 2 3 4 5 6
Quantity of rooms
This indifference curve is downward sloping and convex, imply- give up 10 restaurant meals in return for 1 more room. As
ing that restaurant meals and rooms are ordinary goods for In- her consumption of rooms rises and her consumption of restau-
grid. As Ingrid moves down her indifference curve from V to Z, rant meals falls, she is willing to give up fewer restaurant
she trades reduced consumption of restaurant meals for in- meals in return for each additional room. The flattening of the
creased consumption of housing. However, the terms of that slope as you move from left to right arises from diminishing
trade-off change. As she moves from V to W, she is willing to marginal utility.
We have just seen that for most goods, consumers’ indifference curves are down-
ward sloping and convex. Figure 80.5 shows such an indifference curve. The points la-
beled V, W, X, Y, and Z all lie on this indifference curve—that is, they represent
consumption bundles that yield Ingrid the same level of total utility. The table accom-
panying the figure shows the components of each of the bundles. As we move along the
indifference curve from V to Z, Ingrid’s consumption of housing steadily increases
from 2 rooms to 6 rooms, her consumption of restaurant meals steadily decreases from
30 meals to 10 meals, and her total utility is kept constant. As we move down the indif-
ference curve, then, Ingrid is trading more of one good for less of the other, with the
792 section 14 Market Failure and the Role of Gover nment