
Page 873 - Krugmans Economics for AP Text Book_Neat
P. 873
S-27
SOLUTIONS TO AP REVIEW QUESTIONS
and decreasing the interest rate from r to r in the and the SRAS curve intersect, which is to the left of the
1 2
accompanying figure. LRAS curve.
b. The AD curve shifts to the right. The other curves are
Interest unchanged. The new equilibrium price level and aggregate
rate output are shown on the axes at the new equilibrium
S point. The new equilibrium does not need to be at poten-
tial output.
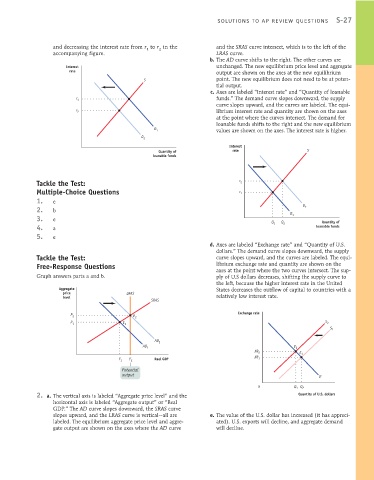
c. Axes are labeled “Interest rate” and “Quantity of loanable
r 1 funds.” The demand curve slopes downward, the supply
curve slopes upward, and the curves are labeled. The equi-
r 2 librium interest rate and quantity are shown on the axes
at the point where the curves intersect. The demand for
loanable funds shifts to the right and the new equilibrium
D 1 values are shown on the axes. The interest rate is higher.
D 2
Interest
Quantity of rate S
loanable funds
Tackle the Test: r 2
Multiple-Choice Questions r 1
1. e
2. b D D 2
3. e Q Q 1 Quantity of
4. a 1 2 loanable funds
5. e
d. Axes are labeled “Exchange rate” and “Quantity of U.S.
dollars.” The demand curve slopes downward, the supply
Tackle the Test: curve slopes upward, and the curves are labeled. The equi-
Free-Response Questions librium exchange rate and quantity are shown on the
axes at the point where the two curves intersect. The sup-
Graph answers parts a and b. ply of U.S dollars decreases, shifting the supply curve to
the left, because the higher interest rate in the United
Aggregate States decreases the outflow of capital to countries with a
price LRAS
level relatively low interest rate.
SRAS
P 2 E 2 Exchange rate
P 1 E 1 S 2
S 1
AD 2
AD 1 E 2
XR 2
E 1
Y 1 Y 2 Real GDP XR 1
Potential
output D
0 Q 1 Q 2
2. a. The vertical axis is labeled “Aggregate price level” and the Quantity of U.S. dollars
horizontal axis is labeled “Aggregate output” or “Real
GDP.” The AD curve slopes downward, the SRAS curve
slopes upward, and the LRAS curve is vertical—all are e. The value of the U.S. dollar has increased (it has appreci-
labeled. The equilibrium aggregate price level and aggre- ated). U.S. exports will decline, and aggregate demand
gate output are shown on the axes where the AD curve will decline.