
Page 3 - Test e-book yru envi
P. 3
268 N.M. Garz on-Barrero et al. / International Biodeterioration & Biodegradation 115 (2016) 266e276
®
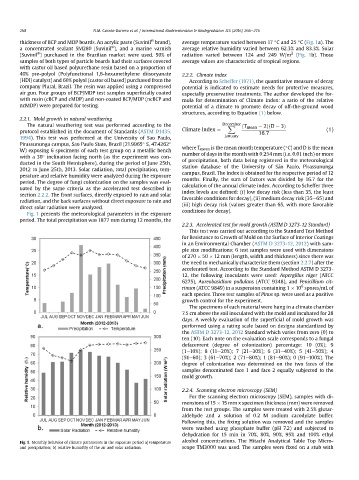
thickness of BCP and MDP boards. An acrylic paste (Suvinil brand), average temperature varied between 17 C and 25 C(Fig. 1a). The
®
a concentrated sealant SM280 (Suvinil ), and a marine varnish average relative humidity varied between 62.3% and 83.3%. Solar
®
(Suvinil ) purchased in the Brazilian market were used. 50% of radiation varied between 124 and 249 W/m 2 (Fig. 1b). Those
samples of both types of particle boards had their surfaces covered average values are characteristic of tropical regions.
with castor oil based polyurethane resin based on a proportion of
40% pre-polyol (Polyfunctional 1,6-hexamethylene diisocyanate 2.2.2. Climate index
(HDI) catalyst) and 60% polyol (castor oil based) purchased from the According to Scheffer (1971), the quantitative measure of decay
company Plural, Brazil. The resin was applied using a compressed potential is indicated to estimate needs for protective measures,
air gun. Four groups of BCP/MDP test samples superficially coated especially preservative treatments. The author developed the for-
with resin (cBCP and cMDP) and non-coated BCP/MDP (ncBCP and mula for determination of Climate Index: a ratio of the relative
ncMDP) were prepared for testing. potential of a climate to promote decay of off-the-ground wood
structures, according to Equation (1) below.
2.2.1. Mold growth in natural weathering
The natural weathering test was performed according to the December ðT mean 2ÞðD 3Þ
X
protocol established in the document of Standards (ASTM D1435, Climate Index ¼ 16:7 (1)
1994). This test was performed at the University of Sao Paulo, January
Pirassununga campus, Sao Paulo State, Brazil (21.9965 S, 47.4262
W) exposing 6 specimens of each test group on a metallic bench where T mean is the mean month temperature ( C) and D is the mean
number of days in the month with 0.254 mm (i.e. 0.01 inch) or more
with a 30 inclination facing north (as the experiment was con-
ducted in the South Hemisphere), during the period of June 25th, of precipitation, both data being registered in the meteorological
station database of the University of S~ ao Paulo, Pirassununga
2012 to June 25th, 2013. Solar radiation, total precipitation, tem-
perature and relative humidity were analyzed during the exposure campus, Brazil. The Index is obtained for the respective period of 12
months. Finally, the sum of factors was divided by 16.7 for the
period. The degree of fungi colonization on the samples was eval-
uated by the same criteria as the accelerated test described in calculation of the annual climate index. According to Scheffer three
index levels are defined: (i) low decay risk (less than 35, the least
section 2.2.2. The front surfaces, directly exposed to rain and solar
radiation, and the back surfaces without direct exposure to rain and favorable conditions for decay), (ii) medium decay risk (35e65) and
direct solar radiation were analyzed. (iii) high decay risk (values greater than 65, with more favorable
Fig. 1 presents the meteorological parameters in the exposure conditions for decay).
period. The total precipitation was 1877 mm during 12 months, the
2.2.3. Accelerated test for mold growth (ASTM D 3273-12 Standard)
This test was carried out according to the Standard Test Method
for Resistance to Growth of Mold on the Surface of Interior Coatings
in an Environmental Chamber (ASTM D 3273-12, 2012) with sam-
ple size modifications; 6 test samples were used with dimensions
of 270 50 12 mm (length, width and thickness) since there was
the need to mechanically characterize them (section 2.2.7) after the
accelerated test. According to the Standard Method ASTM D 3273-
12, the following inoculants were used: Aspergillus niger (ATCC
6275), Aureobasidium pullulans (ATCC 9348), and Penicillium cit-
6
rinum (ATCC 9849) in a suspension containing 1 10 spores/mL of
each species. Three test samples of Pinus sp. were used as a positive
growth control for the experiment.
The specimens of each material were hung in a climate chamber
7.5 cm above the soil inoculated with the mold and incubated for 28
days. A weekly evaluation of the superficial of mold growth was
performed using a rating scale based on designs standardized by
the ASTM D 3273-12, 2012 Standard which varies from zero (0) to
ten (10). Each note on the evaluation scale corresponds to a fungal
defacement (degree of colonization) percentage: 10 (0%); 9
(1e10%); 8 (11e20%); 7 (21e30%); 6 (31e40%); 5 (41e50%); 4
(51e60); 3 (61e70%); 2 (71e80%); 1 (81e90%); 0 (91e100%). The
degree of colonization was determined on the two faces of the
samples denominated face 1 and face 2 equally subjected to the
mold growth.
2.2.4. Scanning electron microscopy (SEM)
For the scanning electron microscopy (SEM), samples with di-
mensions of 15 15 mm x specimen thickness (mm) were removed
from the test groups. The samples were treated with 2.5% glutar-
aldehyde and a solution of 0.2 M sodium cacodylate buffer.
Following this, the fixing solution was removed and the samples
were washed using phosphate buffer (pH 7.2) and subjected to
dehydration for 15 min in 70%, 80%, 90%, 95% and 100% ethyl
Fig. 1. Monthly behavior of climate parameters in the exposure period a) temperature alcohol concentrations. The Hitachi Analytical Table Top Micro-
and precipitation; b) relative humidity of the air and solar radiation. scope TM3000 was used. The samples were fixed on a stub with