
Page 5 - Test e-book yru envi
P. 5
270 N.M. Garz on-Barrero et al. / International Biodeterioration & Biodegradation 115 (2016) 266e276
based material. However, the coating effect is significant, or rather,
“non-coating” and “coating” differ among themselves; just as the
face effect (front and back or 1 and 2) and environment (natural and
accelerated) also show differences with a significance level of 5%.
The fixed effects model allows to conclude that the commercial
wood particle board (MDP) test samples and the alternative sug-
arcane board (BCP) test samples performed the same susceptibility
to mold. The superficial coating with castor oil based polyurethane
resin, the face and the environment of exposure presented a sig-
nificant influence on fungal colonization. The estimated values for
the parameters of the selected model are presented in Table 2.
The results show that there was an effect of the face. For the
natural exposure test, the front faces presented more intense
colonization; the phenomenon is explained by the weathering ef-
fect produced by more severe environmental conditions to which
Fig. 2. The effect of time on the degree of colonization in coated and non-coated BCP they were exposed in relation to the back faces.
and MDP materials in an accelerated test (ASTM D 3273-12, 2012). Coated (cBCP,
cMDP) and non-coated (ncBCP, ncMDP) boards. The monthly averages of the potential fungal attack were
calculated as explained in section 2.2.2. The obtained results are:
July 2, August 3, September 3, October 9, November 16, December
materials subjected to the accelerated test (ASTM D 3273-12, 2012). 25, January 17, February 19, March 13, April 6, May 4, June 2. The
The specimens with a castor oil based polyurethane resin surface annual climate index for this work was 113 considering Pirassu-
coating presented a lower degree of colonization in relation to nunga region, Sao Paulo State, Brazil as a high decay risk area ac-
specimens without the resin surface coating for the two materials cording to classification index by Scheffer (1971). Martins et al.
analyzed. (2003) showed values around 79 for the region of Pelotas in Rio
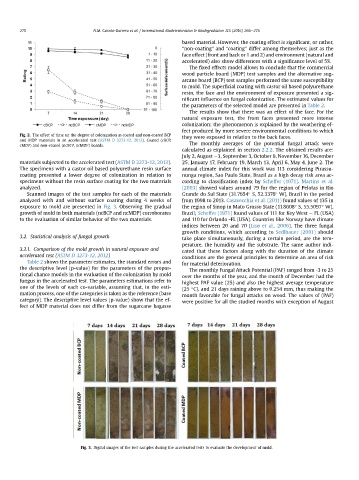
Scanned images of the test samples for each of the materials Grande do Sul State (31.7654 S, 52.3376 W), Brazil in the period
analyzed with and without surface coating during 4 weeks of from 1998 to 2013. Casavecchia et al. (2011) found values of 135 in
exposure to mold are presented in Fig. 3. Observing the gradual the region of Sinop in Mato Grosso State (11.8608 S, 55.5097 W),
growth of mold in both materials (ncBCP and ncMDP) corroborates Brazil; Scheffer (1971) found values of 111 for Key West e FL (USA)
to the evaluation of similar behavior of the two materials. and 110 for Orlando -FL (USA). Countries like Norway have climate
indices between 20 and 70 (Lisø et al., 2006). The three fungal
growth conditions, which according to Sedlbauer (2001) should
3.2. Statistical analysis of fungal growth take place simultaneously, during a certain period, are the tem-
perature, the humidity and the substrate. The same author indi-
3.2.1. Comparison of the mold growth in natural exposure and cated that these factors along with the duration of the climate
accelerated test (ASTM D 3273-12, 2012) conditions are the general principles to determine an area of risk
Table 2 shows the parameter estimates, the standard errors and for material deterioration.
the descriptive level (p-value) for the parameters of the propor- The monthly Fungal Attack Potential (PAF) ranged from -3 to 25
tional chance models in the evaluation of the colonization by mold over the months of the year, and the month of December had the
fungus in the accelerated test. The parameters estimations refer to highest PAF value (25) and also the highest average temperature
one of the levels of each co-variable, assuming that, in the esti-
(25 C), and 21 days raining above to 0.254 mm, thus making the
mation process, one of the categories is taken as the reference (base month favorable for fungal attacks on wood. The values of (PAF)
category). The descriptive level values (p-value) show that the ef-
were positive for all the studied months with exception of August
fect of MDP material does not differ from the sugarcane bagasse
Fig. 3. Digital images of the test samples during the accelerated tests to evaluate the development of mold.