
Page 194 - NGTU_paper_withoutVideo
P. 194
Modern Geomatics Technologies and Applications
(b) (a)
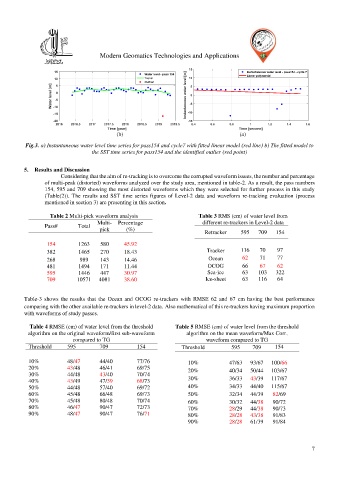
Fig.3. a) Instantaneous water level time series for pass154 and cycle7 with fitted linear model (red line) b) The fitted model to
the SST time series for pass154 and the identified outlier (red point)
5. Results and Discussion
Considering that the aim of re-tracking is to overcome the corrupted waveform issues, the number and percentage
of multi-peak (distorted) waveforms analyzed over the study area, mentioned in table-2. As a result, the pass numbers
154, 595 and 709 showing the most distorted waveforms which they were selected for further process in this study
(Table(2)). The results and SST time series figures of Level-2 data and waveform re-tracking evaluation (process
mentioned in section 3) are presenting in this section.
Table 2 Multi-pick waveform analysis Table 3 RMS (cm) of water level from
Multi- Percentage different re-trackers in Level-2 data
Pass# Total
pick (%) Retracker 595 709 154
154 1263 580 45.92
382 1465 270 18.43 Tracker 116 70 97
268 989 143 14.46 Ocean 62 71 77
481 1494 171 11.44 OCOG 66 67 62
595 1446 447 30.97 Sea-ice 63 103 322
709 10571 4081 38.60 Ice-sheet 63 116 64
Table-3 shows the results that the Ocean and OCOG re-trackers with RMSE 62 and 67 cm having the best performance
comparing with the other available re-trackers in level-2 data. Also mathematical of this re-trackers having maximum proportion
with waveforms of study passes.
Table 4 RMSE (cm) of water level from the threshold Table 5 RMSE (cm) of water level from the threshold
algorithm on the original waveform/first sub-waveform algorithm on the mean waveform/Max Corr.
compared to TG waveform compared to TG
Threshold 595 709 154 Threshold 595 709 154
10% 48/47 44/40 77/76 10% 47/63 93/67 100/66
20% 43/48 46/41 69/75 20% 40/34 50/44 103/67
30% 44/48 43/40 70/74
40% 43/49 47/39 68/73 30% 36/33 43/39 117/67
50% 44/48 57/40 69/72 40% 34/33 44/40 115/67
60% 45/48 66/48 69/73 50% 32/34 44/39 82/69
70% 5/48 80/48 70/74 60% 30/32 44/38 90/72
4
80% 46/47 90/47 72/73 70% 28/29 44/38 90/73
90% 48/47 90/47 76/71 80% 28/28 43/38 91/83
90% 28/28 61/39 91/84
7