
Page 285 - NGTU_paper_withoutVideo
P. 285
Modern Geomatics Technologies and Applications
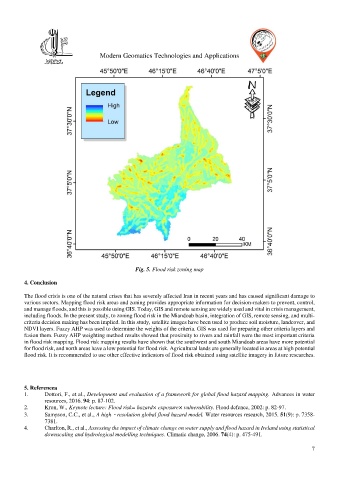
Fig. 5. Flood risk zoning map
4. Conclusion
The flood crisis is one of the natural crises that has severely affected Iran in recent years and has caused significant damage to
various sectors. Mapping flood risk areas and zoning provides appropriate information for decision-makers to prevent, control,
and manage floods, and this is possible using GIS. Today, GIS and remote sensing are widely used and vital in crisis management,
including floods. In the present study, to zoning flood risk in the Miandoab basin, integration of GIS, remote sensing, and multi-
criteria decision making has been implied. In this study, satellite images have been used to produce soil moisture, landcover, and
NDVI layers. Fuzzy AHP was used to determine the weights of the criteria. GIS was used for preparing other criteria layers and
fusion them. Fuzzy AHP weighting method results showed that proximity to rivers and rainfall were the most important criteria
in flood risk mapping. Flood risk mapping results have shown that the southwest and south Miandoab areas have more potential
for flood risk, and north areas have a low potential for flood risk. Agricultural lands are generally located in areas at high potential
flood risk. It is recommended to use other effective indicators of flood risk obtained using satellite imagery in future researches.
5. Referencea
1. Dottori, F., et al., Development and evaluation of a framework for global flood hazard mapping. Advances in water
resources, 2016. 94: p. 87-102.
2. Kron, W., Keynote lecture: Flood risk= hazard× exposure× vulnerability. Flood defence, 2002: p. 82-97.
3. Sampson, C.C., et al., A high‐resolution global flood hazard model. Water resources research, 2015. 51(9): p. 7358-
7381.
4. Charlton, R., et al., Assessing the impact of climate change on water supply and flood hazard in Ireland using statistical
downscaling and hydrological modelling techniques. Climatic change, 2006. 74(4): p. 475-491.
7