
Page 347 - NGTU_paper_withoutVideo
P. 347
Modern Geomatics Technologies and Applications
3. Exposure assessment
Tehran urban air is affected by various factors such as pollutant sources, meteorological and climatic factors, topographic
conditions and chemical reactions between pollutants, each of which has a negative impact on air quality [48]. Air pollution in
Tehran has always been a major problem [49] and has been influenced by several factors during recent years, including a rapid
increase in population, high personal car ownership, and limited public transportation options [48]. Urban traffic with the
emission of PM10, PM2.5, NO2, SO2, O3 and CO pollutants is the source of 80%-85% of air pollution in Tehran [50]. PM10 and
PM2.5 pollutants refer to particulate matters with an aerodynamic diameter of less than 10 and 2.5 microns [51]. Previous research
show that the potential impacts of air pollution on human health include mental health [16-18]. Local measurement of pollutant
concentrations is costly and is done on Air Quality Index (AQI) monitoring stations belonging to Tehran Municipality AQCC.
However, it is necessary to generalize this information measured at the stations for regional analysis to the whole study area in
order to map their distribution in the city for further studies. This paper has considered the study of the zoning of PM 10 and PM2.5
pollutants to determine high-risk and air polluted districts of Tehran based on the concentration of these pollutants and the
possible correlation with cognitive impairment and Alzheimer disease with air pollution.
3.1 Exposure assessment through spatial interpolation-based method
In [47], Faraji et al. investigate the effect of exposure to ambient air pollution on the prevalence of asthma in adults in
Tehran. They have used mean concentrations of six air pollutants including O3, CO, NO2, SO2, PM10, and PM2.5 which have been
acquired from the air monitoring stations in Tehran Municipality AQCC from November 2014 to February 2016. Exposure to
the air pollutants was assessed through estimation of air pollutant concentrations at the clusters using geospatial information
system (GIS) [52] in the ArcGIS 10.1. Concentrations of the air pollutants at the clusters were estimated based on distance of
each cluster from the air monitoring stations, and Ordinary Kriging (OK) was used as a geostatistical methods to produce raster
layers for each pollutant. Finally, the map was produced by overlapping each layer by the Raster calculation Function. High and
low concentrations of air pollutants were classified using colour marking and the validation process was performed based on the
mean square error (RMSE). Exposure to the pollutants was assessed according to the concentration of air pollutants in the clusters.
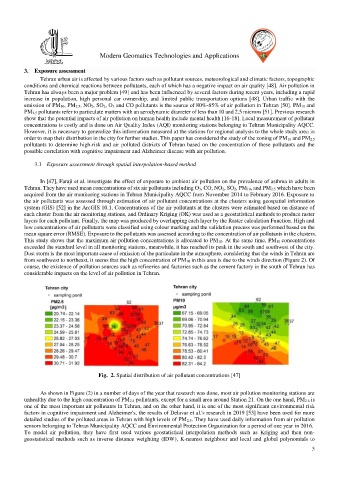
This study shows that the maximum air pollution concentrations is allocated to PM 10. At the same time, PM10 concentrations
exceeded the standard level in all monitoring stations, meanwhile, it has reached its peak in the south and southwest of the city.
Dust storm is the most important cause of emission of the particulate in the atmosphere, considering that the winds in Tehran are
from southwest to northeast, it seems that the high concentration of PM 10 in this area is due to the winds direction (Figure 2). Of
course, the existence of pollution sources such as refineries and factories such as the cement factory in the south of Tehran has
considerable impacts on the level of air pollution in Tehran.
Fig. 2. Spatial distribution of air pollutant concentrations [47]
As shown in Figure (2) in a number of days of the year that research was done, most air pollution monitoring stations are
unhealthy due to the high concentration of PM 2.5 pollutants, except for a small area around Station 21. On the one hand, PM 2.5 is
one of the most important air pollutants in Tehran, and on the other hand, it is one of the most significant environmental risk
factors in cognitive impairment and Alzheimer's, the results of Delavar et al.'s research in 2019 [53] have been used for more
detailed studies of the polluted areas in Tehran with high levels of PM 2.5. They have used daily information from air pollution
sensors belonging to Tehran Municipality AQCC and Environmental Protection Organization for a period of one year in 2016.
To model air pollution, they have first used various geostatistical interpolation methods such as Kriging and then non-
geostatistical methods such as inverse distance weighting (IDW), K-nearest neighbour and local and global polynomials to
3