
Page 400 - NGTU_paper_withoutVideo
P. 400
Modern Geomatics Technologies and Applications
In addition to the having impact on capacity of the road, rainfall affects the amount of free flow velocity, hence, at the
time of raining, the driver's sense of safety decreases and also the decrease in visibility reduces the driver's speed. Therefore, due
to the impact of the road's conditions on free-flowing speed, if drivers drive at less than the free-flowing speed in rainy conditions,
there will be a delay and ultimately cause the traffic demand to overcome the road's capacity. In expressing the effect of rainfall
on traffic density, it should be noted that when it rains, with a decrease in urban traffic safety, drivers increase their longitudinal
distance from the vehicle in front which reduces the number of vehicles per unit length. In this case, the path capacity mode
decreases. According to the afore-mentioned issues, it was determined that by identifying the points where the amount of urban
road traffic during the rainfall exceeds the capacity of the route, an adjustment should be made in the traffic assessment of the
routes in the urban management system to prevail road rain conditions.
2. Implementation
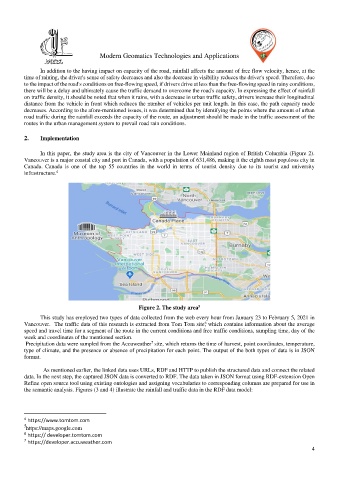
In this paper, the study area is the city of Vancouver in the Lower Mainland region of British Columbia (Figure 2).
Vancouver is a major coastal city and port in Canada, with a population of 631,486, making it the eighth most populous city in
Canada. Canada is one of the top 55 countries in the world in terms of tourist density due to its tourist and university
infrastructure. 4
5
Figure 2. The study area
This study has employed two types of data collected from the web every hour from January 23 to February 5, 2021 in
6
Vancouver. The traffic data of this research is extracted from Tom Tom site, which contains information about the average
speed and travel time for a segment of the route in the current conditions and free traffic conditions, sampling time, day of the
week and coordinates of the mentioned section.
Precipitation data were sampled from the Accuweather site, which returns the time of harvest, point coordinates, temperature,
7
type of climate, and the presence or absence of precipitation for each point. The output of the both types of data is in JSON
format.
As mentioned earlier, the linked data uses URLs, RDF and HTTP to publish the structured data and connect the related
data. In the next step, the captured JSON data is converted to RDF. The data taken in JSON format using RDF-extension Open
Refine open source tool using existing ontologies and assigning vocabularies to corresponding columns are prepared for use in
the semantic analysis. Figures (3 and 4) illustrate the rainfall and traffic data in the RDF data model:
4 https://www.tomtom.com
5 https://maps.google.com
6 https:// developer.tomtom.com
7 https://developer.accuweather.com
4