
Page 439 - NGTU_paper_withoutVideo
P. 439
Modern Geomatics Technologies and Applications
Table 1. The percentage of regions in different spatial hot/cold spot
Hot spot Cold spot
99% 95% 90% No 90% 95% 99%
Confidence Confidence Confidence Significant Confidence Confidence Confidence
Cases 9.33 1.13 1.59 87.95 0 0 0
Deaths 16.03 0.41 0.41 67.34 3.44 12.37 0
Next, a Corovavirus pattern map was prepared with the STHCSA. The neighborhood time step must be
specified in the preparation of this map. The neighborhood time step is the number of time-step intervals to be used
in the neighborhood of analysis. This value specifies which features are evaluated together to determine local
clustering in space-time cube [13]. Hot / Cold spots of COVID-19 confirmed cases in the world countries with one-
day neighbors are shown in Fig. 2.
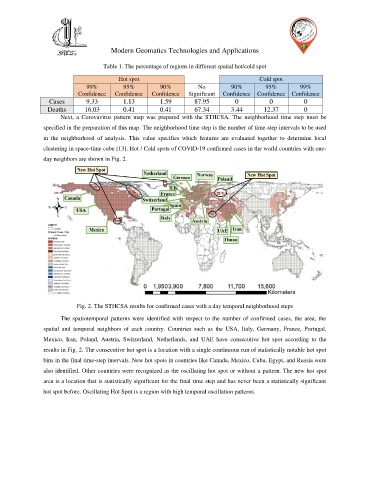
Fig. 2. The STHCSA results for confirmed cases with a day temporal neighborhood steps
The spatiotemporal patterns were identified with respect to the number of confirmed cases, the area, the
spatial and temporal neighbors of each country. Countries such as the USA, Italy, Germany, France, Portugal,
Mexico, Iran, Poland, Austria, Switzerland, Netherlands, and UAE have consecutive hot spot according to the
results in Fig. 2. The consecutive hot spot is a location with a single continuous run of statistically notable hot spot
bins in the final time-step intervals. New hot spots in countries like Canada, Mexico, Cuba, Egypt, and Russia were
also identified. Other countries were recognized as the oscillating hot spot or without a pattern. The new hot spot
area is a location that is statistically significant for the final time step and has never been a statistically significant
hot spot before. Oscillating Hot Spot is a region with high temporal oscillation patterns.