
Page 442 - NGTU_paper_withoutVideo
P. 442
Modern Geomatics Technologies and Applications
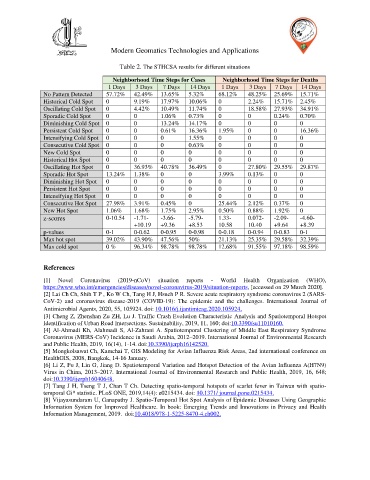
Table 2. The STHCSA results for different situations
Neighborhood Time Steps for Cases Neighborhood Time Steps for Deaths
1 Days 3 Days 7 Days 14 Days 1 Days 3 Days 7 Days 14 Days
No Pattern Detected 57.72% 42.49% 13.65% 5.32% 68.12% 48.25% 25.69% 15.71%
Historical Cold Spot 0 9.19% 17.97% 10.06% 0 2.24% 15.71% 2.45%
Oscillating Cold Spot 0 4.42% 10.49% 11.74% 0 18.58% 27.93% 34.91%
Sporadic Cold Spot 0 0 1.06% 0.73% 0 0 0.24% 0.70%
Diminishing Cold Spot 0 0 13.24% 14.17% 0 0 0 0
Persistent Cold Spot 0 0 0.61% 16.36% 1.95% 0 0 16.36%
Intensifying Cold Spot 0 0 0 1.55% 0 0 0 0
Consecutive Cold Spot 0 0 0 0.63% 0 0 0 0
New Cold Spot 0 0 0 0 0 0 0 0
Historical Hot Spot 0 0 0 0 0 0 0 0
Oscillating Hot Spot 0 36.93% 40.78% 36.49% 0 27.80% 29.55% 29.87%
Sporadic Hot Spot 13.24% 1.38% 0 0 3.99% 0.13% 0 0
Diminishing Hot Spot 0 0 0 0 0 0 0 0
Persistent Hot Spot 0 0 0 0 0 0 0 0
Intensifying Hot Spot 0 0 0 0 0 0 0 0
Consecutive Hot Spot 27.98% 3.91% 0.45% 0 25.44% 2.12% 0.37% 0
New Hot Spot 1.06% 1.68% 1.75% 2.95% 0.50% 0.88% 1.92% 0
z-scores 0-10.54 -1.71- -3.66- -5.79- 1.33- 0.072- -2.09- -4.60-
+10.19 +9.36 +8.53 10.58 10.40 +9.64 +8.39
p-values 0-1 0-0.62 0-0.95 0-0.98 0-0.18 0-0.94 0-0.83 0-1
Max hot spot 39.02% 43.90% 47.56% 50% 21.13% 25.35% 29.58% 32.39%
Max cold spot 0 % 96.34% 98.78% 98.78% 12.68% 91.55% 97.18% 98.59%
References
[1] Novel Coronavirus (2019-nCoV) situation reports - World Health Organization (WHO),
https://www.who.int/emergencies/diseases/novel-coronavirus-2019/situation-reports, [accessed on 29 March 2020].
[2] Lai Ch Ch, Shih T P , Ko W Ch, Tang H J, Hsueh P R. Severe acute respiratory syndrome coronavirus 2 (SARS-
CoV-2) and coronavirus disease-2019 (COVID-19): The epidemic and the challenges. International Journal of
Antimicrobial Agents, 2020, 55, 105924. doi: 10.1016/j.ijantimicag.2020.105924.
[3] Cheng Z, Zhenshan Zu ZH, Lu J. Traffic Crash Evolution Characteristic Analysis and Spatiotemporal Hotspot
Identification of Urban Road Intersections. Sustainability, 2019, 11, 160; doi:10.3390/su11010160.
[4] Al-Ahmadi Kh, Alahmadi S, Al-Zahrani A. Spatiotemporal Clustering of Middle East Respiratory Syndrome
Coronavirus (MERS-CoV) Incidence in Saudi Arabia, 2012–2019. International Journal of Environmental Research
and Public Health, 2019, 16(14), 1-14. doi:10.3390/ijerph16142520.
[5] Mongkolsawat Ch, Kamchai T, GIS Modeling for Avian Influenza Risk Areas, 2nd international conference on
HealthGIS, 2008, Bangkok, 14-16 January.
[6] Li Z, Fu J, Lin G, Jiang D. Spatiotemporal Variation and Hotspot Detection of the Avian Influenza A(H7N9)
Virus in China, 2013–2017. International Journal of Environmental Research and Public Health, 2019, 16, 648;
doi:10.3390/ijerph16040648.
[7] Tang J H, Tseng T J, Chan T Ch. Detecting spatio-temporal hotspots of scarlet fever in Taiwan with spatio-
temporal Gi* statistic. PLoS ONE, 2019,14(4): e0215434. doi: 10.1371/ journal.pone.0215434.
[8] Vijayasundaram U, Ganapathy J. Spatio-Temporal Hot Spot Analysis of Epidemic Diseases Using Geographic
Information System for Improved Healthcare. In book: Emerging Trends and Innovations in Privacy and Health
Information Management, 2019. doi:10.4018/978-1-5225-8470-4.ch002.