
Page 438 - NGTU_paper_withoutVideo
P. 438
Modern Geomatics Technologies and Applications
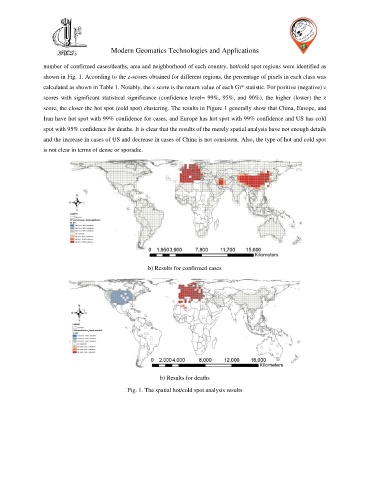
number of confirmed cases/deaths, area and neighborhood of each country, hot/cold spot regions were identified as
shown in Fig. 1. According to the z-scores obtained for different regions, the percentage of pixels in each class was
calculated as shown in Table 1. Notably, the z score is the return value of each Gi* statistic. For positive (negative) z
scores with significant statistical significance (confidence level= 99%, 95%, and 90%), the higher (lower) the z
score, the closer the hot spot (cold spot) clustering. The results in Figure 1 generally show that China, Europe, and
Iran have hot spot with 99% confidence for cases, and Europe has hot spot with 99% confidence and US has cold
spot with 95% confidence for deaths. It is clear that the results of the merely spatial analysis have not enough details
and the increase in cases of US and decrease in cases of China is not consistent. Also, the type of hot and cold spot
is not clear in terms of dense or sporadic.
b) Results for confirmed cases
b) Results for deaths
Fig. 1. The spatial hot/cold spot analysis results