
Page 479 - NGTU_paper_withoutVideo
P. 479
Modern Geomatics Technologies and Applications
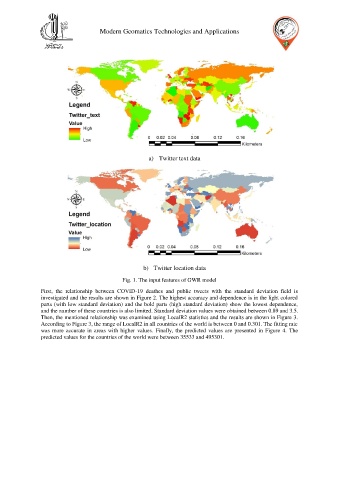
a) Twitter text data
b) Twitter location data
Fig. 1. The input features of GWR model
First, the relationship between COVID-19 deathes and public tweets with the standard deviation field is
investigated and the results are shown in Figure 2. The highest accuracy and dependence is in the light colored
parts (with low standard deviation) and the bold parts (high standard deviation) show the lowest dependence,
and the number of these countries is also limited. Standard deviation values were obtained between 0.89 and 3.5.
Then, the mentioned relationship was examined using LocalR2 statistics and the results are shown in Figure 3.
According to Figure 3, the range of LocalR2 in all countries of the world is between 0 and 0.301. The fitting rate
was more accurate in areas with higher values. Finally, the predicted values are presented in Figure 4. The
predicted values for the countries of the world were between 35533 and 495301.