
Page 481 - NGTU_paper_withoutVideo
P. 481
Modern Geomatics Technologies and Applications
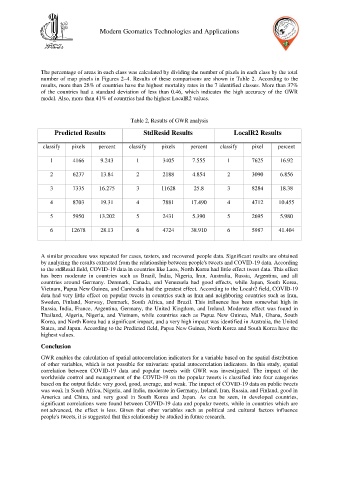
The percentage of areas in each class was calculated by dividing the number of pixels in each class by the total
number of map pixels in Figures 2–4. Results of these comparisons are shown in Table 2. According to the
results, more than 28% of countries have the highest mortality rates in the 7 identified classes. More than 37%
of the countries had a standard deviation of less than 0.46, which indicates the high accuracy of the GWR
model. Also, more than 41% of countries had the highest LocalR2 values.
Table 2, Results of GWR analysis
Predicted Results StdResid Results LocalR2 Results
classify pixels percent classify pixels percent classify pixel percent
1 4166 9.243 1 3405 7.555 1 7625 16.92
2 6237 13.84 2 2188 4.854 2 3090 6.856
3 7335 16.275 3 11628 25.8 3 8284 18.38
4 8703 19.31 4 7881 17.490 4 4712 10.455
5 5950 13.202 5 2431 5.390 5 2695 5.980
6 12678 28.13 6 4724 38.910 6 5987 41.404
A similar procedure was repeated for cases, testers, and recovered people data. Significant results are obtained
by analyzing the results extracted from the relationship between people's tweets and COVID-19 data. According
to the stdResid field, COVID-19 data in countries like Laos, North Korea had little effect tweet data. This effect
has been moderate in countries such as Brazil, India, Nigeria, Iran, Australia, Russia, Argentina, and all
countries around Germany. Denmark, Canada, and Venezuela had good effects, while Japan, South Korea,
Vietnam, Papua New Guinea, and Cambodia had the greatest effect. According to the Localr2 field, COVID-19
data had very little effect on popular tweets in countries such as Iran and neighboring countries such as Iran,
Sweden, Finland, Norway, Denmark, South Africa, and Brazil. This influence has been somewhat high in
Russia, India, France, Argentina, Germany, the United Kingdom, and Ireland. Moderate effect was found in
Thailand, Algeria, Nigeria, and Vietnam, while countries such as Papua New Guinea, Mali, Ghana, South
Korea, and North Korea had a significant impact, and a very high impact was identified in Australia, the United
States, and Japan. According to the Predicted field, Papua New Guinea, North Korea and South Korea have the
highest values.
Conclusion
GWR enables the calculation of spatial autocorrelation indicators for a variable based on the spatial distribution
of other variables, which is not possible for univariate spatial autocorrelation indicators. In this study, spatial
correlation between COVID-19 data and popular tweets with GWR was investigated. The impact of the
worldwide control and management of the COVID-19 on the popular tweets is classified into four categories
based on the output fields: very good, good, average, and weak. The impact of COVID-19 data on public tweets
was weak in South Africa, Nigeria, and India, moderate in Germany, Ireland, Iran, Russia, and Finland, good in
America and China, and very good in South Korea and Japan. As can be seen, in developed countries,
significant correlations were found between COVID-19 data and popular tweets, while in countries which are
not advanced, the effect is less. Given that other variables such as political and cultural factors influence
people's tweets, it is suggested that this relationship be studied in future research.