
Page 509 - NGTU_paper_withoutVideo
P. 509
Modern Geomatics Technologies and Applications
2 . Case study area and datasets
.
2.1 Case study area
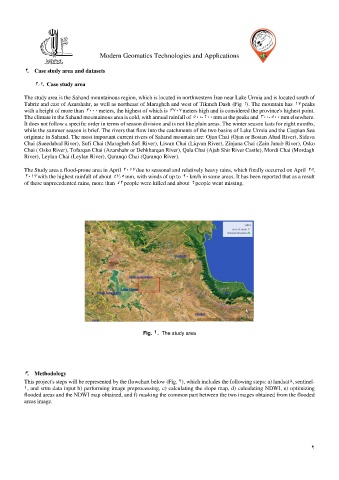
The study area is the Sahand mountainous region, which is located in northwestern Iran near Lake Urmia and is located south of
Tabriz and east of Azarshahr, as well as northeast of Maragheh and west of Tikmeh Dash (Fig 1). The mountain has 12 peaks
with a height of more than 3111 meters, the highest of which is 3212 meters high and is considered the province's highest point.
The climate in the Sahand mountainous area is cold, with annual rainfall of 511-611 mm at the peaks and 311-511 mm elsewhere.
It does not follow a specific order in terms of season division and is not like plain areas. The winter season lasts for eight months,
while the summer season is brief. The rivers that flow into the catchments of the two basins of Lake Urmia and the Caspian Sea
originate in Sahand. The most important current rivers of Sahand mountain are: Ojan Chai (Ojan or Bostan Abad River), Sidava
Chai (Saeedabad River), Sufi Chai (Maragheh Safi River), Liwan Chai (Liqvan River), Zinjana Chai (Zain Janab River), Osko
Chai ( Osko River), Tofarqan Chai (Azarshahr or Dehkharqan River), Qala Chai (Ajab Shir River Castle), Mordi Chai (Mordagh
River), Leylan Chai (Leylan River), Qaranqo Chai (Qaranqo River).
The Study area a flood-prone area in April 2112 due to seasonal and relatively heavy rains, which finally occurred on April 25,
2112 with the highest rainfall of about 9275 mm, with winds of up to 41 km/h in some areas. It has been reported that as a result
of these unprecedented rains, more than 92 people were killed and about 6 people went missing.
Fig. 1. The study area
3 . Methodology
This project's steps will be represented by the flowchart below (Fig. 2), which includes the following steps: a) landsat8, sentinel-
1, and srtm data input b) performing image preprocessing, c) calculating the slope map, d) calculating NDWI, e) optimizing
flooded areas and the NDWI map obtained, and f) masking the common part between the two images obtained from the flooded
areas image.
2