
Page 511 - NGTU_paper_withoutVideo
P. 511
Modern Geomatics Technologies and Applications
3.1 datasets
.
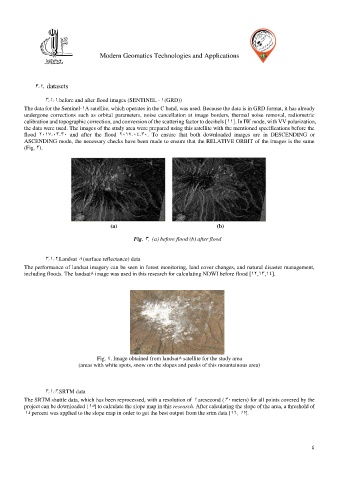
37171 . before and after flood images (SENTINEL -1 (GRD))
The data for the Sentinel-1A satellite, which operates in the C band, was used. Because the data is in GRD format, it has already
undergone corrections such as orbital parameters, noise cancellation at image borders, thermal noise removal, radiometric
calibration and topographic correction, and conversion of the scattering factor to decibels [11]. In IW mode, with VV polarization,
the data were used. The images of the study area were prepared using this satellite with the mentioned specifications before the
flood 2112-13-31 and after the flood 2112-19-31. To ensure that both downloaded images are in DESCENDING or
ASCENDING mode, the necessary checks have been made to ensure that the RELATIVE ORBIT of the images is the same
(Fig. 3).
(a) (b)
Fig. 3 . (a) before flood (b) after flood
37172 . Landsat 8 (surface reflectance) data
The performance of landsat imagery can be seen in forest monitoring, land cover changes, and natural disaster management,
including floods. The landsat8 image was used in this research for calculating NDWI before flood [12,13,19].
Fig. 9. Image obtained from landsat8 satellite for the study area
(areas with white spots, snow on the slopes and peaks of this mountainous area)
37173 . SRTM data
The SRTM shuttle data, which has been reprocessed, with a resolution of 1 arcsecond (31 meters) for all points covered by the
project can be downloaded [15] to calculate the slope map in this research. After calculating the slope of the area, a threshold of
19 percent was applied to the slope map in order to get the best output from the srtm data [16, 12].
9