
Page 513 - NGTU_paper_withoutVideo
P. 513
Modern Geomatics Technologies and Applications
(a) (b)
Fig.7 . (a) NDWI calculated from LANDSAT 8 image (b) after thresholding NDWI image
Fig. 8 shows the change detection image based on SAR images.
Fig.8 The image obtained by dividing the two images after and before the flood
After thresholding the image obtained from the flood changes and removing steep slope areas from it, this image and the
thresholded NDWI image overlap.To do this, an RGB image was created and the flood image was placed in the red band and
the NDWI image was placed in the green band (Fig 4a).
Yellow areas are due to snow on the peak and should be removed. The resulting image will be in the form of Fig. 4b.
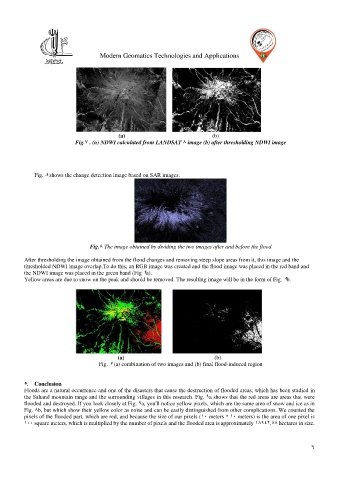
(a) (b)
Fig. 4 (a) combination of two images and (b) final flood-induced region
5. Conclusion
Floods are a natural occurrence and one of the disasters that cause the destruction of flooded areas, which has been studied in
the Sahand mountain range and the surrounding villages in this research. Fig. 4a shows that the red areas are areas that were
flooded and destroyed. If you look closely at Fig. 4a, you'll notice yellow pixels, which are the same area of snow and ice as in
Fig. 8b, but which show their yellow color as noise and can be easily distinguished from other complications. We counted the
pixels of the flooded part, which are red, and because the size of our pixels (11 meters * 11 meters) is the area of one pixel is
111 square meters, which is multiplied by the number of pixels and the flooded area is approximately 18492.88 hectares in size.
6