
Page 17 - Professorial Lecture - Prof Kasanda
P. 17
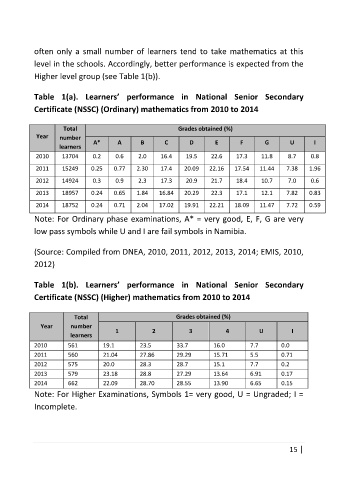
often only a small number of  learners tend to take mathematics at this
          level in the schools. Accordingly, better performance is expected from the
          Higher level group (see Table 1(b)).

          Table  1(a).  Learners’  performance  in  National  Senior  Secondary
          Certificate (NSSC) (Ordinary) mathematics from 2010 to 2014


                 Total                       Grades obtained (%)
          Year   number
                        A*    A     B     C     D     E      F     G     U     I
                learners
          2010   13704   0.2   0.6   2.0   16.4   19.5   22.6   17.3   11.8   8.7   0.8
          2011   15249   0.25   0.77   2.30   17.4   20.09   22.16   17.54   11.44   7.38   1.96
          2012   14924   0.3   0.9   2.3   17.3   20.9   21.7   18.4   10.7   7.0   0.6
          2013   18957   0.24   0.65   1.84   16.84   20.29   22.3   17.1   12.1   7.82   0.83
          2014   18752   0.24   0.71   2.04   17.02   19.91   22.21   18.09   11.47   7.72   0.59
          Note: For Ordinary phase examinations, A* = very good, E, F, G are very
          low pass symbols while U and I are fail symbols in Namibia.

          (Source: Compiled from DNEA, 2010, 2011, 2012, 2013, 2014; EMIS, 2010,
          2012)


          Table  1(b).  Learners’  performance  in  National  Senior  Secondary
          Certificate (NSSC) (Higher) mathematics from 2010 to 2014

                   Total                     Grades obtained (%)
           Year    number
                              1        2        3        4       U       I
                  learners
          2010    561      19.1     23.5     33.7     16.0     7.7     0.0
          2011    560      21.04    27.86    29.29    15.71    5.5     0.71
          2012    575      20.0     28.3     28.7     15.1     7.7     0.2
          2013    579      23.18    28.8     27.29    13.64    6.91    0.17
          2014    662      22.09    28.70    28.55    13.90    6.65    0.15
          Note: For Higher Examinations, Symbols 1= very good, U = Ungraded; I =
          Incomplete.


                                                                         15 |