Page 133 - PERSIAN 1 1873_1879 Admin Report1_Neat
P. 133

•V

                AND MUSCAT POLITICAL AGENCY FOR TIIE YEAR 1874-7\          31
                                         A.
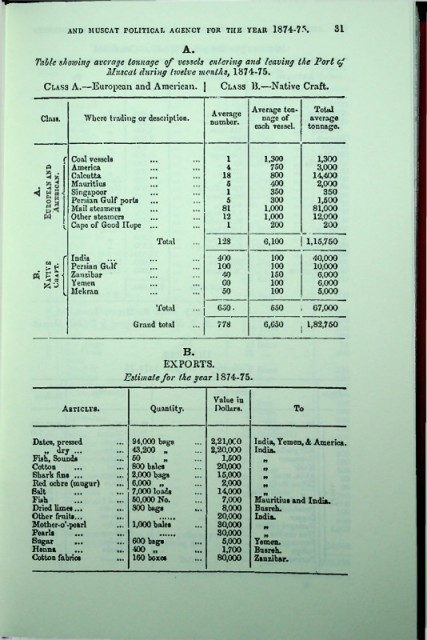
         Table showing average tonnage of vessels entering and leaving the Tort cj
                         Muscat during twelve months, 1874-75.
           Class A.—European and American. J      Class 13.—Native Craft.

                                                         Average ton­  Total
                                                Average
          Class.    Where trading or description.          nage of    average
                                                number.
                                                          each vessel.  tonnage.

               f Coal vessels                      1        1,300      1,300
           p     America                           4         750       3.000
                 Calcutta                         18         800      14,400
                 Mauritius                         5         400       2.000
                 Singapoor                         1         350         350
                 Persian Gulf ports                5         300        1,600
                 Mail steamers                    81        1,000     81,000
                 Other steamers                   12        1,000      12,000
                 Capo of Good Hope                 1         200         200
                                    Total        128        6,100   | 1,15,750
               f  India                          400         100      40.000
                                                                       10.000
                 Persian Gulf
                                                 100
                                                             100
                 Zanzibar                         40         150        6,000
             31  I  Yemen                         GO         100        6,000
               l  Mekran                          50         100        5,000
                                    Total        650-        650    ,   67,000
                               Grand total       778        6,050    1,82,750

                                          B.
                                     EXPORTS.
                            Estimate for the year 1874-75.

                                                Value in
               Articles.          Quantity.      Dollars.         To


        Dates, pressed        94,000 bags       2,21'OCO  India, Yemen, & America.
           „ dry ...          43,200 „          2,20,000  India.
        Fish, Sounds          60                  1,600
        Cotton                800 bales          20,000    t»
        Shark fins ...        2,000 bags         15.000    n
        Red ochre (mugur)     6,000 „             2,000    tt
        Salt                  7.000 loads        14.000    n
        Fish                  60.000 No.          7.000   Mauritius and India.
        Dried limes...        800 bags      • ••  8.000   Busreh.
        Other fruits...                          20.000   India.
        Mother-o‘-pearl       1,000 bales        30,000     ft
        Pearls    ...                            30.000     n
        Sugar                 600 bags            5,000   Yemen.
        Henna                 •100 „        • ••  1,700  Busreh.
        Cotton fabrics        160 boxes          80.000  Zanzibar.
   128   129   130   131   132   133   134   135   136   137   138