
Page 83 - نموذج
P. 83
19
526 Writing Recommendation Reports
in this book within the report, use the same text attributes — capitalization, boldface, ital-
For more about text attributes, ics, and outline style (traditional or decimal) — in the table of contents.
see Ch. 11, p. 275. When adding page numbers to your report, remember two points:
• The table of contents page does not contain an entry for itself.
in this book • Front matter is numbered using lowercase Roman numerals (i, ii, and so
For more about pagination, see forth), often centered at the bottom of the page. The title page of a report is
Ch. 9, p. 220. not numbered, although it represents page i. The abstract is usually num-
bered page ii. The table of contents is usually not numbered, although it
represents page iii. The body of the report is numbered with Arabic numer-
als (1, 2, and so on), typically in the upper outside corner of the page.
See page 535 in the sample recommendation report for an example of a table
of contents.
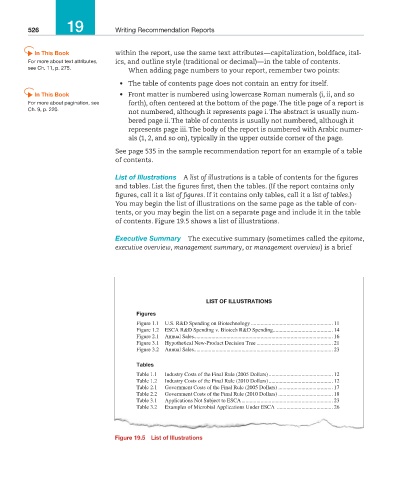
List of Illustrations A list of illustrations is a table of contents for the figures
and tables. List the figures first, then the tables. (If the report contains only
figures, call it a list of figures. If it contains only tables, call it a list of tables.)
You may begin the list of illustrations on the same page as the table of con-
tents, or you may begin the list on a separate page and include it in the table
of contents. Figure 19.5 shows a list of illustrations.
Executive Summary The executive summary (sometimes called the epitome,
executive overview, management summary, or management overview) is a brief
liSt of illUStRationS
figures
Figure 1.1 U.S. R&D Spending on Biotechnology ............................................................ 11
Figure 1.2 ESCA R&D Spending v. Biotech R&D Spending............................................ 14
Figure 2.1 Annual Sales...................................................................................................... 16
Figure 3.1 Hypothetical New-Product Decision Tree ........................................................ 21
Figure 3.2 Annual Sales...................................................................................................... 23
tables
Table 1.1 Industry Costs of the Final Rule (2005 Dollars) ............................................... 12
Table 1.2 Industry Costs of the Final Rule (2010 Dollars) ............................................... 12
Table 2.1 Government Costs of the Final Rule (2005 Dollars) ........................................ 17
Table 2.2 Government Costs of the Final Rule (2010 Dollars) ........................................ 18
Table 3.1 Applications Not Subject to ESCA ................................................................... 23
Table 3.2 Examples of Microbial Applications Under ESCA ......................................... 26
figure 19.5 list of illustrations
19_MAR_67948_Ch19_512-562.indd 526 11/29/11 3:36 PM