
Page 386 - Health Impact Assessment of policies related to local pharmaceutical industry development towards technology readiness and access to medicines: HIAPP
P. 386
Health Impact Assessment of policies related to local pharmaceutical industry
372
development towards technology readiness and access to medicines: HIAPP
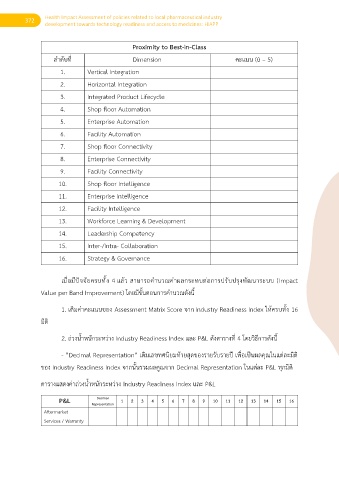
Proximity to Best-in-Class
ล าดับที่ Dimension คะแนน (0 – 5)
1. Vertical Integration
2. Horizontal Integration
3. Integrated Product Lifecycle
4. Shop floor Automation
5. Enterprise Automation
6. Facility Automation
7. Shop floor Connectivity
8. Enterprise Connectivity
9. Facility Connectivity
10. Shop floor Intelligence
11. Enterprise Intelligence
12. Facility Intelligence
13. Workforce Learning & Development
14. Leadership Competency
15. Inter-/Intra- Collaboration
16. Strategy & Governance
เมื่อมีปัจจัยครบทั้ง 4 แล้ว สามารถค านวณค่าผลกระทบต่อการปรับปรุงพัฒนาระบบ (Impact
Value per Band Improvement) โดยมีขั้นตอนการค านวณดังนี้
1. เติมค่าคะแนนของ Assessment Matrix Score จาก Industry Readiness Index ให้ครบทั้ง 16
มิติ
2. ถ่วงน ้าหนักระหว่าง Industry Readiness Index และ P&L ดังตารางที่ 4 โดยวิธีการดังนี้
- “Decimal Representation” เติมเลขทศนิยมท้ายสุดของรายรับรายปี เพื่อเป็นผลคุณในแต่ละมิติ
ของ Industry Readiness Index จากนั้นรวมผลคูณจาก Decimal Representation ในแต่ละ P&L ทุกมิติ
ตารางแสดงค่าถ่วงน ้าหนักระหว่าง Industry Readiness Index และ P&L
P&L Decimal 1 2 3 4 5 6 7 8 9 10 11 12 13 14 15 16
Representation
Aftermarket
Services / Warranty