
Page 123 - DUOKOPT BIBLIOBOOK
P. 123
EFFICACY
VISUAL FUNCTION, OPTIC NERVE STRUCTURE, AND
OCULAR BLOOD FLOW PARAMETERS AFTER 1 YEAR OF
GLAUCOMA TREATMENT WITH FIXED COMBINATIONS
Januleviciene I, et al. Eur J Ophthalmol. 2009 Sep-Oct;19(5):790-7.
ABSTRACT
PURPOSE: To compare the effects of latanoprost/timolol (LTFC) versus dorzolamide/timolol (DTFC)
fixed combinations on IOP, visual function, and retrobulbar blood flow in patients with OAG.
METHODS: Prospective, randomized, double masked, parallel study on 30 patients with POAG de-
fined by characteristic glaucomatous visual field loss, optic nerve head damage, and IOP greater than
or equal to 21 mmHg. All patients received 4 weeks of timolol treatment prior to randomization to LTFC
or DTFC treatment. Measurements after randomization were taken at 1, 6, and 12 months.
STUDY CRITERIA: Arterial blood pressure; IOP; color Doppler imaging of the ophthalmic artery (OA),
central retinal artery, and short posterior ciliary artery (SPCA); scanning laser polarimetry; Humphrey
visual field examination; and adverse events.
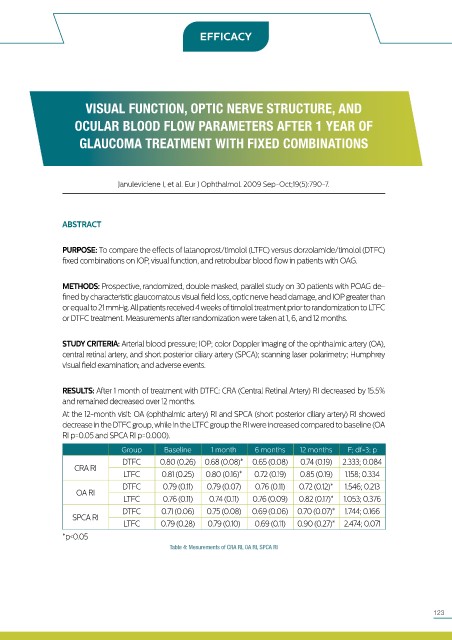
RESULTS: After 1 month of treatment with DTFC: CRA (Central Retinal Artery) RI decreased by 15.5%
and remained decreased over 12 months.
At the 12-month visit: OA (ophthalmic artery) RI and SPCA (short posterior ciliary artery) RI showed
decrease in the DTFC group, while in the LTFC group the RI were increased compared to baseline (OA
RI p=0.05 and SPCA RI p=0.000).
Group Baseline 1 month 6 months 12 months F; df=3; p
DTFC 0.80 (0.26) 0.68 (0.08)* 0.65 (0.08) 0.74 (0.19) 2.333; 0.084
CRA RI
LTFC 0.81 (0.25) 0.80 (0.16)* 0.72 (0.19) 0.85 (0.19) 1.158; 0.334
DTFC 0.79 (0.11) 0.79 (0.07) 0.76 (0.11) 0.72 (0.12)* 1.546; 0.213
OA RI
LTFC 0.76 (0.11) 0.74 (0.11) 0.76 (0.09) 0.82 (0.17)* 1.053; 0.376
DTFC 0.71 (0.06) 0.75 (0.08) 0.69 (0.06) 0.70 (0.07)* 1.744; 0.166
SPCA RI
LTFC 0.79 (0.28) 0.79 (0.10) 0.69 (0.11) 0.90 (0.27)* 2.474; 0.071
*p<0.05
Table 4: Mesurements of CRA RI, OA RI, SPCA RI
123