
Page 128 - DUOKOPT BIBLIOBOOK
P. 128
DUOKOPT - bibliography book - CONFIDENTIAL - document for exclusive use by personnel of Laboratoires Théa – DO NOT DISTRIBUTE
®
Results of 1-year fixed combination glaucoma treatment
TABLE I - INTRAOCULAR AND ARTERIAL BLOOD PRESSURE LEVELS DURING THE FOLLOW-UP VISITS
Baseline Treatment groups
1 mo 6 mo 12 mo
DTFC 22.10 (2.69) 16.33 (2.11) 16.17 (2.81) 17.10 (2.42)
LTFC 20.57 (3.25) 14.90 (2.69) 14.70 (2.57) 15.13 (3.42)
SBP-1 157.70 (14.90) 152.73 (16.90)* 161.80 (18.40)* 148.50 (11.18)
SBP-2 146.70 (20.22) 136.0 (13.67)* 146.80 (15.40)* 144.20 (17.41)
DBP-1 92.13 (8.12) 93.73 (15.41) 97.43 (12.19)* 91.07 (8.47)
DBP-2 86.80 (7.53) 81.10 (7.04) 86.97 (9.49)* 86.57 (9.10)
*p<0.05 Statistically significant.
DTFC = dorzolamide/timolol; LTFC = latanoprost/timolol; SBP-1 and DBP-1 = systolic blood pressure, diastolic blood pressure, DTFC group; SBP-2 and DBP-2
= systolic blood pressure, diastolic blood pressure, LTFC group.
blood flow was evaluated with Color Doppler imaging (CDI)
(Accuvix XQ, Medison Co., Ltd., Seoul, Korea).
CDI is an ultrasound technique that combines b-scan gray
scale imaging of tissue structure, colored representation
of blood flow based on Doppler shifted frequencies, and
pulsed-Doppler measurement of blood flow velocities.
Blood flow velocities were measured in the ophthalmic ar-
tery (OA), central retinal artery (CRA), and short posterior
ciliary artery (SPCA) with a 7.5 MHz linear probe calcu-
lating peak systolic velocity (PSV), end-diastolic velocity
(EDV), and resistive index (RI) in each vessel.
All patients’ data were collected in the Eye Clinic of Kaunas
Medical University, Lithuania, and the CDI readings were
performed by a reading center (Glaucoma Research and
Diagnostic Laboratories, Department of Ophthalmology,
Indiana University School of Medicine, IN).
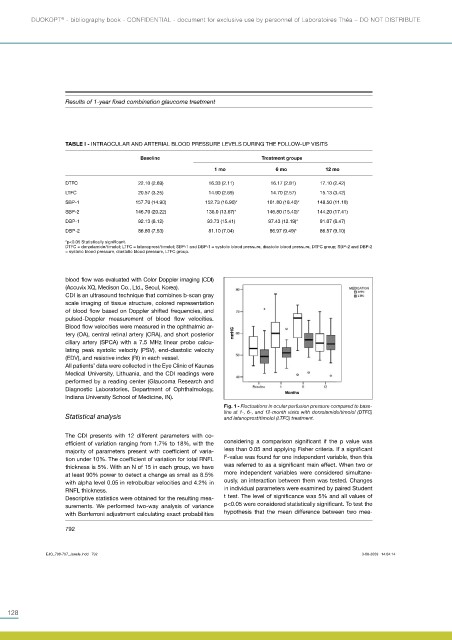
Fig. 1 - Fluctuations in ocular perfusion pressure compared to base-
line at 1-, 6-, and 12-month visits with dorzolamide/timolol (DTFC)
Statistical analysis and latanoprost/timolol (LTFC) treatment.
The CDI presents with 12 different parameters with co-
efficient of variation ranging from 1.7% to 18%, with the considering a comparison significant if the p value was
majority of parameters present with coefficient of varia- less than 0.05 and applying Fisher criteria. If a significant
tion under 10%. The coefficient of variation for total RNFL F-value was found for one independent variable, then this
thickness is 5%. With an N of 15 in each group, we have was referred to as a significant main effect. When two or
at least 90% power to detect a change as small as 8.5% more independent variables were considered simultane-
with alpha level 0.05 in retrobulbar velocities and 4.2% in ously, an interaction between them was tested. Changes
RNFL thickness. in individual parameters were examined by paired Student
Descriptive statistics were obtained for the resulting mea- t test. The level of significance was 5% and all values of
surements. We performed two-way analysis of variance p<0.05 were considered statistically significant. To test the
with Bonferroni adjustment calculating exact probabilities hypothesis that the mean difference between two mea-
792
EJO_790-797_Janule.indd 792 3-08-2009 14:04:14
128