
Page 129 - DUOKOPT BIBLIOBOOK
P. 129
EFFICACY
Januleviciene et al
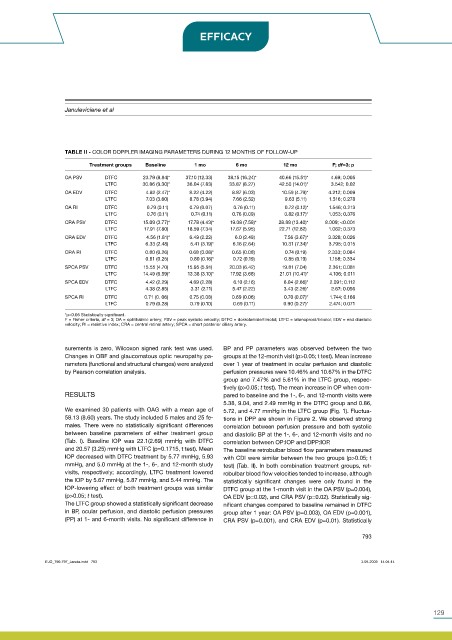
TABLE II - COLOR DOPPLER IMAGING PARAMETERS DURING 12 MONTHS OF FOLLOW-UP
Treatment groups Baseline 1 mo 6 mo 12 mo F; df=3; p
OA PSV DTFC 23.79 (8.84)* 37.10 (12.33) 38.15 (16.24)* 40.66 (15.51)* 4.69; 0.005
LTFC 30.86 (9.30)* 36.04 (7.83) 33.87 (8.27) 42.50 (14.01)* 3.542; 0.02
OA EDV DTFC 4.82 (2.47)* 8.22 (4.22) 8.87 (6.03) 10.59 (4.79)* 4.212; 0.009
LTFC 7.03 (3.60) 8.78 (3.94) 7.66 (2.52) 9.63 (5.11) 1.316; 0.278
OA RI DTFC 0.79 (0.11) 0.79 (0.07) 0.76 (0.11) 0.72 (0.12)* 1.546; 0.213
LTFC 0.76 (0.11) 0.74 (0.11) 0.76 (0.09) 0.82 (0.17)* 1.053; 0.376
CRA PSV DTFC 15.09 (3.77)* 17.78 (4.43)* 19.08 (7.59)* 28.88 (13.40)* 8.009; <0.001
LTFC 17.91 (7.80) 18.59 (7.34) 17.67 (5.95) 22.71 (12.82) 1.062; 0.373
CRA EDV DTFC 4.56 (1.81)* 6.49 (2.22) 6.0 (2.49) 7.56 (3.67)* 3.328; 0.026
LTFC 6.33 (2.48) 5.41 (3.19)* 6.16 (2.64) 10.31 (7.34)* 3.795; 0.015
CRA RI DTFC 0.80 (0.26) 0.68 (0.08)* 0.65 (0.08) 0.74 (0.19) 2.333; 0.084
LTFC 0.81 (0.25) 0.80 (0.16)* 0.72 (0.19) 0.85 (0.19) 1.158; 0.334
SPCA PSV DTFC 15.55 (4.70) 15.95 (5.91) 20.03 (6.42) 19.81 (7.04) 2.361; 0.081
LTFC 14.49 (6.59)* 13.38 (3.10)* 17.92 (3.68) 21.01 (10.41)* 4.106; 0.011
SPCA EDV DTFC 4.42 (2.29) 4.69 (2.28) 6.10 (2.16) 6.04 (2.66)* 2.091; 0.112
LTFC 4.38 (2.85) 3.31 (2.11) 5.47 (2.22) 3.43 (2.26)* 2.67; 0.056
SPCA RI DTFC 0.71 (0. 06) 0.75 (0.08) 0.69 (0.06) 0.70 (0.07)* 1.744; 0.168
LTFC 0.79 (0.28) 0.79 (0.10) 0.69 (0.11) 0.90 (0.27)* 2.474; 0.071
*p<0.05 Statistically significant.
F = Fisher criteria, df = 3; OA = ophthalmic artery; PSV = peak systolic velocity; DTFC = dorzolamide/timolol; LTFC = latanoprost/timolol; EDV = end diastolic
velocity; RI = resistive index; CRA = central retinal artery; SPCA = short posterior ciliary artery.
surements is zero, Wilcoxon signed rank test was used. BP and PP parameters was observed between the two
Changes in OBF and glaucomatous optic neuropathy pa- groups at the 12-month visit (p>0.05; t test). Mean increase
rameters (functional and structural changes) were analyzed over 1 year of treatment in ocular perfusion and diastolic
by Pearson correlation analysis. perfusion pressures were 10.46% and 10.67% in the DTFC
group and 7.47% and 5.61% in the LTFC group, respec-
tively (p>0.05; t test). The mean increase in OP when com-
RESULTS pared to baseline and the 1-, 6-, and 12-month visits were
5.38, 9.04, and 2.49 mmHg in the DTFC group and 0.86,
We examined 30 patients with OAG with a mean age of 5.72, and 4.77 mmHg in the LTFC group (Fig. 1). Fluctua-
58.13 (8.60) years. The study included 5 males and 25 fe- tions in DPP are shown in Figure 2. We observed strong
males. There were no statistically significant differences correlation between perfusion pressure and both systolic
between baseline parameters of either treatment group and diastolic BP at the 1-, 6-, and 12-month visits and no
(Tab. I). Baseline IOP was 22.1(2.69) mmHg with DTFC correlation between OP:IOP and DPP:IOP.
and 20.57 (3.25) mmHg with LTFC (p=0.1715, t test). Mean The baseline retrobulbar blood flow parameters measured
IOP decreased with DTFC treatment by 5.77 mmHg, 5.93 with CDI were similar between the two groups (p>0.05; t
mmHg, and 5.0 mmHg at the 1-, 6-, and 12-month study test) (Tab. II). In both combination treatment groups, ret-
visits, respectively; accordingly, LTFC treatment lowered robulbar blood flow velocities tended to increase, although
the IOP by 5.67 mmHg, 5.87 mmHg, and 5.44 mmHg. The statistically significant changes were only found in the
IOP-lowering effect of both treatment groups was similar DTFC group at the 1-month visit in the OA PSV (p=0.004),
(p>0.05; t test). OA EDV (p=0.02), and CRA PSV (p=0.02). Statistically sig-
The LTFC group showed a statistically significant decrease nificant changes compared to baseline remained in DTFC
in BP, ocular perfusion, and diastolic perfusion pressures group after 1 year: OA PSV (p=0.003), OA EDV (p=0.001),
(PP) at 1- and 6-month visits. No significant difference in CRA PSV (p=0.001), and CRA EDV (p=0.01). Statistically
793
EJO_790-797_Janule.indd 793 3-08-2009 14:04:14
129