
Page 81 - Human Umbilical Cord Mesenchymal Stem Cells
P. 81
Umbilical Cord MSC to Support Cell Transplantation 1481
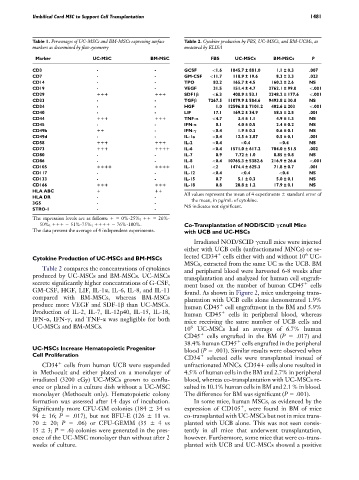
Table 1. Percentages of UC-MSCs and BM-MSCs expressing surface Table 2. Cytokine production by FBS, UC-MSCs, and BM-UCMs, as
markers as determined by flow cytometry measured by ELISA
Marker UC-MSC BM-MSC FBS UC-MSCs BM-MSCs P
CD3 - - GCSF \1.6 1845.7 ± 881.0 1.1 ± 0.3 .007
CD7 - - GM-CSF \11.7 118.9 ± 19.6 8.3 ± 3.3 .023
CD14 - - TPO 83.2 165.7 ± 4.5 160.2 ± 2.6 NS
CD19 - - VEGF 31.5 151.4 ± 4.7 2762.1 ± 99.0 \.001
CD29 111 111 SDF1b \6.3 408.9 ± 53.1 2348.2 ± 177.6 \.001
CD33 - - TGFb 7267.5 11079.9 ± 584.6 9493.8 ± 30.8 NS
CD34 - - HGF 1.0 12596.8 ± 7101.2 402.6 ± 203 \.001
CD40 - - LIF 17.1 169.2 ± 34.9 58.5 ± 2.5 .001
CD44 111 111 TNF-a \4.7 3.4 ± 1.1 4.9 ± 1.3 NS
CD45 - - IFN-a 0.1 4.0 ± 0.5 2.4 ± 0.2 NS
CD49b 11 - IFN-g \0.4 1.9 ± 0.3 0.6 ± 0.1 NS
CD49d - - IL-1a \0.4 12.5 ± 3.87 0.5 ± 0.1 .001
CD58 111 111 IL-2 \0.4 \0.4 \0.4 NS
CD73 111 1111 IL-6 \0.4 1571.0 ± 617.2 704.0 ± 51.5 .002
CD80 - - IL-7 0.9 7.72 ± 1.0 8.85 ± 0.8 NS
CD86 - - IL-8 \0.4 10765.3 ± 5382.6 216.9 ± 26.6 \.001
CD105 1111 1111 IL-11 \2 1474.4 ± 625.3 71.8 ± 0.7 .001
CD117 - - IL-12 \0.4 \0.4 \0.4 NS
CD133 - - IL-15 0.7 5.1 ± 0.3 5.0 ± 0.1 NS
CD166 111 111 IL-18 0.8 20.8 ± 1.2 17.9 ± 0.1 NS
HLA ABC 1 11 All values represent the mean of 4 experiments 6 standard error of
HLA DR - -
3G5 - - the mean, in pg/mL of cytokine.
NS indicates not significant.
STRO-1 - -
The expression levels are as follows: 15 0%-25%; 11 5 26%-
50%; 111 5 51%-75%; 1111 5 76%-100%. Co-Transplantation of NOD/SCID gcnull Mice
The data present the average of 4 independent experiments. with UCB and UC-MSCs
Irradiated NOD/SCID gcnull mice were injected
either with UCB cells (unfractionated MNCs) or se-
6
1
lected CD34 cells either with and without 10 UC-
Cytokine Production of UC-MSCs and BM-MSCs
MSCs, extracted from the same UC as the UCB. BM
Table 2 compares the concentrations of cytokines
and peripheral blood were harvested 6-8 weeks after
produced by UC-MSCs and BM-MSCs. UC-MSCs
transplantation and analyzed for human cell engraft-
secrete significantly higher concentrations of G-CSF, 1
ment based on the number of human CD45 cells
GM-CSF, HGF, LIF, IL-1a, IL-6, IL-8, and IL-11
found. As shown in Figure 2, mice undergoing trans-
compared with BM-MSCs, whereas BM-MSCs
plantation with UCB cells alone demonstrated 1.9%
produce more VEGF and SDF-1b than UC-MSCs. 1
human CD45 cell engraftment in the BM and 5.9%
Production of IL-2, IL-7, IL-12p40, IL-15, IL-18, human CD45 1 cells in peripheral blood, whereas
IFN-a, IFN-g, and TNF-a was negligible for both mice receiving the same number of UCB cells and
UC-MSCs and BM-MSCs. 10 6 UC-MSCs had an average of 6.7% human
CD45 1 cells engrafted in the BM (P 5 .017) and
1
38.4% human CD45 cells engrafted in the peripheral
UC-MSCs Increase Hematopoietic Progenitor blood (P 5 .001). Similar results were observed when
Cell Proliferation 1
CD34 selected cells were transplanted instead of
CD34 1 cells from human UCB were suspended unfractionated MNCs. CD341 cells alone resulted in
in Methocult and either plated on a monolayer of 4.5% of human cells in the BM and 2.7% in peripheral
irradiated (3200 cGy) UC-MSCs grown to conflu- blood, whereas co-transplantation with UC-MSCs re-
ence or plated in a culture dish without a UC-MSC sulted in 10.1% human cells in BM and 2.1 % in blood.
monolayer (Methocult only). Hematopoietic colony The difference for BM was significant (P 5 .001).
formation was assessed after 14 days of incubation. In some mice, human MSCs, as evidenced by the
1
Significantly more CFU-GM colonies (184 6 34 vs expression of CD105 , were found in BM of mice
94 6 16; P 5 .017), but not BFU-E (126 6 11 vs. co-transplanted with UC-MSCs but not in mice trans-
70 6 20; P 5 .06) or CFU-GEMM (35 6 4vs planted with UCB alone. This was not seen consis-
15 6 3; P 5 .6) colonies were generated in the pres- tently in all mice that underwent transplantation,
ence of the UC-MSC monolayer than without after 2 however. Furthermore, some mice that were co-trans-
weeks of culture. planted with UCB and UC-MSCs showed a positive