
Page 15 - EXOSOMES
P. 15
www.advancedsciencenews.com www.small-journal.com
Figure 2. Biochemical profile of plasma samples from control (PBS) and treated (goat milk exosomes) mice, collected 24 h after dose administration.
Asterisks (*) indicate statistically significant differences (p < 0.05), observed only for triglycerides.
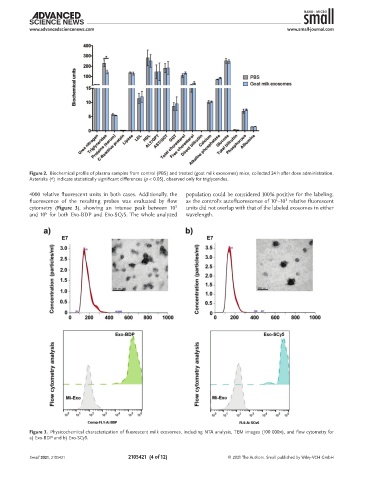
4000 relative fluorescent units in both cases. Additionally, the population could be considered 100% positive for the labeling,
3
1
fluorescence of the resulting probes was evaluated by flow as the control’s autofluorescence of 10 –10 relative fluorescent
5
cytometry (Figure 3), showing an intense peak between 10 units did not overlap with that of the labeled exosomes in either
6
and 10 for both Exo-BDP and Exo-SCy5. The whole analyzed wavelength.
Figure 3. Physicochemical characterization of fluorescent milk exosomes, including NTA analysis, TEM images (100 000×), and flow cytometry for
a) Exo-BDP and b) Exo-SCy5.
Small 2021, 2105421 2105421 (4 of 12) © 2021 The Authors. Small published by Wiley-VCH GmbH